Fig. 1.
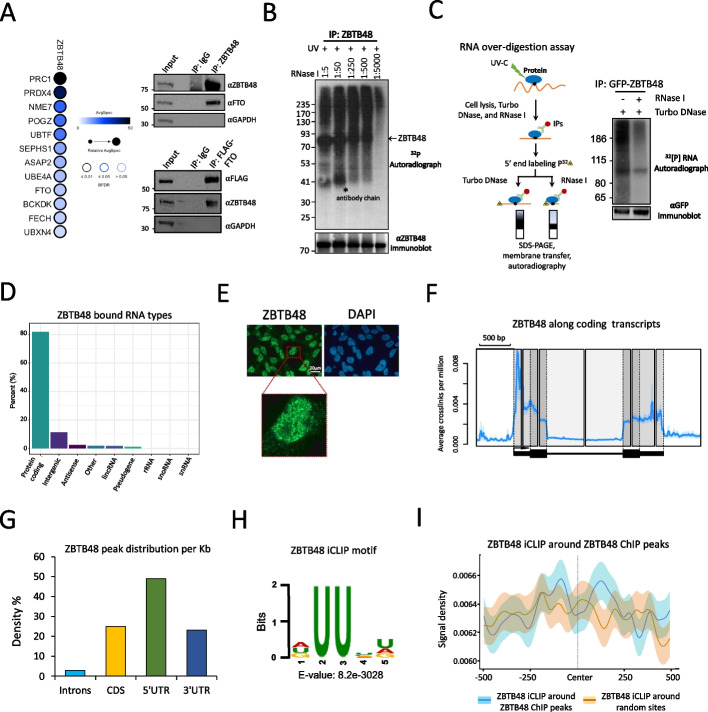
ZBTB48 interacts with FTO and binds to RNA in cells. A Left, Dot plot representation of ZBTB48 protein-protein interactions. Right, Interaction of ZBTB48 with FTO detected by co-immunoprecipitation. Cell lysates were treated with Benzonase prior to IPs. Note: The inputs and IPs were loaded twice on 4-12% Bis-Tris SDS polyacrylamide gels and probed with the indicated antibodies. B CLIP autoradiography of 32P-labeled ZBTB48-RNA complexes was performed after RNase I treatment at various dilution. The Western blot in the bottom panel shows the recovery of ZBTB48. C Left, Schematic representation of CLIP RNA over-digestion assay. Right, Autoradiograph of immunopurified 32P-labeled ZBTB48-RNA complexes after RNase I and/or DNase I over-digestion. The bottom panel Western blot indicates the recovery of GFP-ZBTB48 protein. D Bar chart representing the distribution (%) of ZBTB48-bound RNA types. E Immunofluorescence (IF) analysis to examine the localization of ZBTB48 in HEK293 cells. Experiment was performed using an anti-ZBTB48 antibody. For nuclear counterstaining, DAPI was used. F Standardized metaplot profile showing the density of ZBTB48 as average crosslinks per million. Black arrow indicates transcription start site (TSS). G Bar chart representing the distribution of ZBTB48 mRNA CITS peaks per Kb of mRNA (FDR ≤ 0.01). H Enriched sequence motif found in ZBTB48 iCLIP-seq peaks. E-value represents the significance of the motif against randomly assorted sequences. I iCLIP-seq signal density of ZBTB48 around either ZBTB48 ChIP-seq peaks or random sites. Shaded area indicates a standard error of mean (SEM). See also Additional file 1: Fig. S1, S2; Additional file 2, 3, 4: Tables S1, S2, and S3

