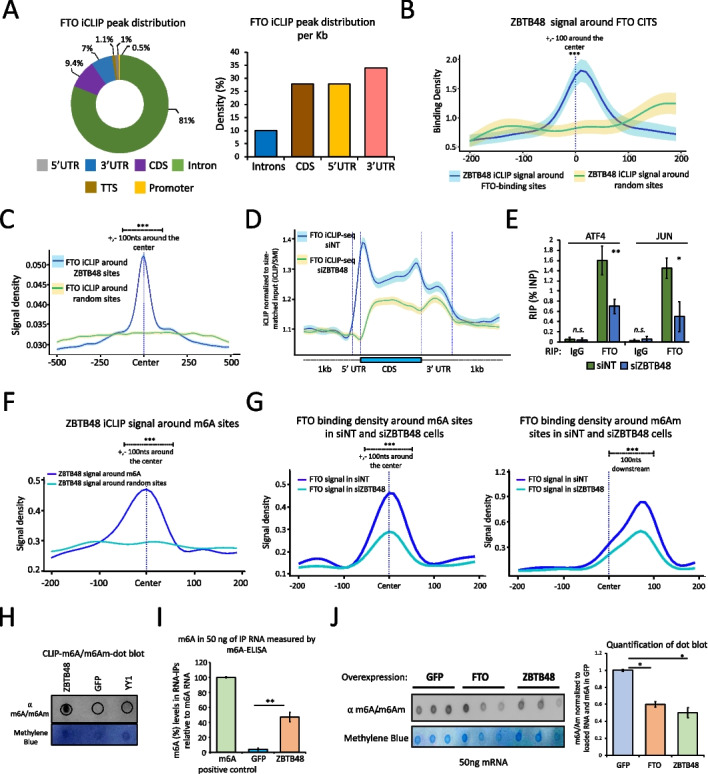
Fig. 2.

RNA-binding sites of ZBTB48 and FTO coincide on target transcripts. A Left, FTO iCLIP-seq CITS distribution. Absolute numbers of peaks are used. Right, Bar chart showing the distribution of FTO iCLIP-seq peaks per Kb along mRNA. B Metagene profile showing ZBTB48 iCLIP-seq signal density around either FTO RNA-binding sites or random sites. Quantification of signal densities was performed for +/-100bp around the center (∗∗∗p ≤ 0.001, Wilcoxon (Mann-Whitney) test). Shaded area: SEM. C FTO iCLIP-seq signal density around either ZBTB48 CITS or random sites (∗∗∗p ≤ 0.001, Wilcoxon test). D Standardized metaplot profiles showing the binding density (iCLIP/size-matched input) of FTO in either siZBTB48 or siNT cells. E Bar graph showing FTO RIP-qPCR experiments after knocking down ZBTB48 (biological replicates (n) = 4, student’s t test, ∗∗p ≤ 0.01, ∗p ≤ 0.05, error bars: SEM). F ZBTB48 iCLIP-seq signal density around either m6A sites or random sites. G FTO signal density around m6A (left) or m6Am (right) sites in cells treated with either siZBTB48 or siNT. Note: For F and G, quantification of signal densities was performed for +/-100bp around the center; ∗∗∗p ≤ 0.001, Wilcoxon test. H ZBTB48 CLIP dot blot showing the enrichment of m6A/m6Am modified RNA. Top panel: anti-m6A, bottom panel: Methylene blue. I Bar plot showing the enrichment of m6A. RIP was performed using either GFP-ZBTB48 or GFP-alone cells, and RNA was analyzed using an m6A ELISA kit. Synthetic RNA containing m6A was used as a positive control (error bars: SEM, n =3, student’s t test, ∗∗p ≤ 0.01). J m6A dot blot using polyadenylated RNA purified from either GFP-alone, or ZBTB48-overexpressing, or FTO-overexpressing cells (top panel: anti-m6A, bottom panel: Methylene blue, error bars: SEM, ∗p ≤ 0.05; student’s t-test; n = 3). See also Additional file 1: Fig. S3, S4, Additional file 5: Table S4
