Fig. 3.
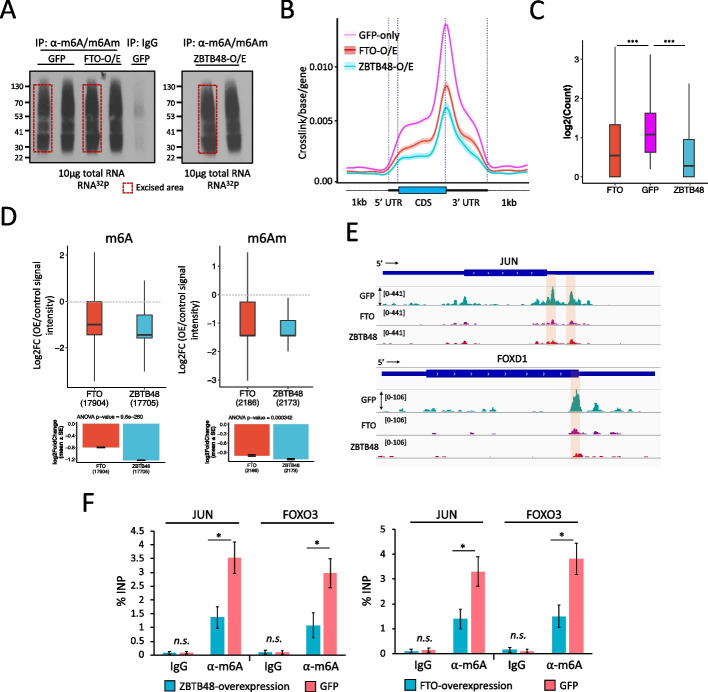
ZBTB48 affects cellular m6A/m6Am levels. A Autoradiographs of 32P-labeled immunopurified (IP) anti-m6A-RNA complexes. Red boxes indicate the excised areas. B standardized metagene plots showing miCLIP-seq signal density for RNA purified from cells overexpressing GFP-alone, or GFP-ZBTB48, or GFP-FTO. C Boxplot representation of read counts for DRACH motif containing m6A sites across different samples, as indicated (Mann–Whitney test, ∗∗∗p ≤ 0.001; outliers not shown in the plot). D Box plot showing differential methylation analysis using miCLIP data generated from either GFP-ZBTB48-overexpressing or GFP-FTO-overexpressing cells versus GFP control cells. Analysis was performed with the DESeq2 package, which accounts for the read depth in each sample, using reads corresponding to internal m6A (left) and terminal m6Am (right) sites. Outliers are not shown in the box plots. Dotted lines indicate the base line signal (i.e., m6A or m6Am in GFP cells). Bottom bar plots indicate the mean values for the indicated groups along with p-values (ANOVA, post hoc Tukey HSD). E Genome browser snapshots of JUN and FOXD1 gene tracks show the location and coverage of miCLIP in GFP- or GFP-ZBTB48- or FTO-overexpressing cells. Locations of the putative m6A sites are highlighted. F Bar plots showing the m6A levels for JUN and FOXO3 transcripts estimated using m6A-RIP-qPCR on RNA purified from either ZBTB48-overexpressing or GFP-only cells (left) or from either FTO-overexpressing or GFP-only cells (right). Data are represented as % input. Note, for qPCRs: biological replicates n = 5, student’s t-test, ∗∗∗p ≤ 0.001, ∗∗p ≤ 0.01, ∗p ≤ 0.05, n.s.: non-significant, error bars denote SEM. See also Additional file 1: Fig. S5, S6; Additional file 6, 7, 8, 9: Table S5, S6, S7,S8

