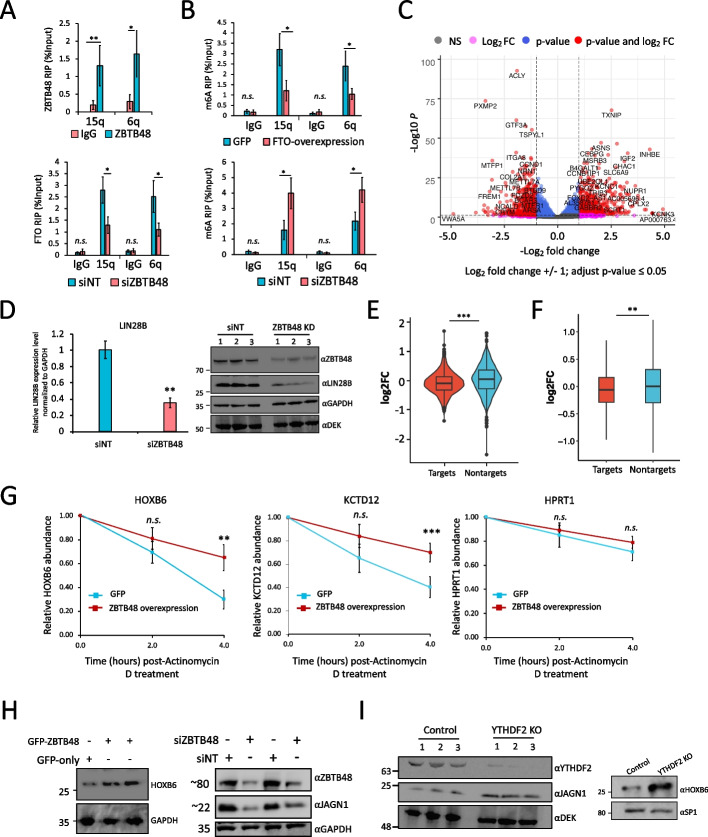
Fig. 5.
ZBTB48 knockdown alters gene expression and affects mRNA stability. A Top: RIP-qRT-PCR to examine binding of ZBTB48 to TERRA transcripts in U2OS cells. Bottom: FTO RIP-qPCR bar graph showing effects of siNT- or siZBTB48-treatment on binding of FTO to TERRA in U2OS cells. TERRA was detected using specific primers against the 15q and 6q chromosomes. B Bar plots showing the m6A levels for TERRA transcripts (15q and 6q) in U2OS cells estimated using m6A-RIP-qPCR in GFP- and FTO-overexpressing cells (top), or ZBTB48 knockdown and siNT-treated cells (bottom). Data are represented as % input. C Volcano plot representation of genes differentially expressed in ZBTB48 knockdown HEK293 cells in comparison with control siNT-treated cells. Each dot represents a single gene. Vertical dotted lines represent log2fold change of 1, and highly significant genes are shown as red dots with labels indicating some of the gene names. D left, qRT-PCR results to examine the differential expression of LIN28B in ZBTB48 knockdown cells. Right, Western blotting analysis in whole cell lysates prepared from either siZBTB48 (siZBTB48 #1 + #2) or siNT-treated cells. Blots were probed with the indicated antibodies. Note: DEK and GAPDH were used as loading controls. E Relative abundance of ZBTB48 mRNA targets (based on iCLIP-seq) and non-targets after ZBTB48 KD in HEK293 cells. Violin plots show mean log2 fold change values for the indicated groups (p ≤ 0.01 ANOVA, post hoc Tukey HSD). F: Box plot shows mean log2 fold change values for the abundance of mRNA from m6A genes (targets) and non-m6A genes (non-targets) after ZBTB48 KD in HEK293 cells (p ≤ 0.01 ANOVA, post hoc Tukey HSD; Outliers are not depicted). G qRT-PCR quantification of selected m6A-containing mRNAs targeted by ZBTB48 after treating GFP or GFP-ZBTB48 overexpressing cells with Actinomycin D for the indicated times. HPRT1 serves as negative control. H Western blotting analysis in whole cell lysates prepared from cells treated in the indicated ways. Note: ZBTB48 KD (right) was carried out using two different siRNAs, i.e., siZBTB48 #1 and #2 (the second and fourth lanes, respectively). Blots were probed with the indicated antibodies. I Western blotting analysis in whole cell lysates prepared from either YTHDF2 KO or control cells. Blots were probed with the indicated antibodies. Note: For qPCRs (including RIPs): biological replicates n = 5, student’s t-test, ∗∗∗p ≤ 0.001, ∗∗p ≤ 0.01, ∗p ≤ 0.05, n.s.: non-significant. Error bars represent SEM. See also Additional file 1: Fig. S9, S10; Additional file 10: Table S9

