Fig. 6.
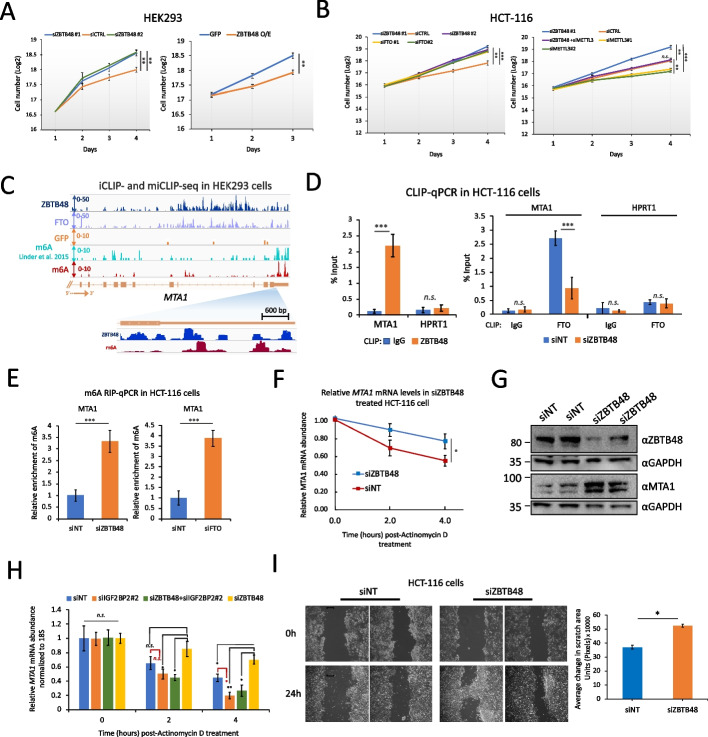
ZBTB48 inhibits cellular proliferation. A Effects of ZBTB48 KD (left) or overexpression (right) on cell proliferation in HEK293 cells (error bars denote SEM, n = 4, ∗∗p ≤ 0.01, ∗p ≤ 0.05, two-way ANOVA). Cell counts are presented as log2. B Equal numbers of HCT-116 cells were transfected with the indicated siRNAs in biological triplicates and seeded at the same time in 6-well plates. Cells were separately transfected and seeded for each time point in biological triplicates. Error bars denote SEM. ∗∗∗p ≤ 0.001, ∗∗p ≤ 0.01, ∗p ≤ 0.05 (two-way ANOVA). C Representative genome browser snapshot for MTA1 locus showing the read coverage for ZBTB48 iCLIP-seq, miCLIP-seq (GFP samples), and previously published miCLIP-seq data in HEK293 cells. D Left: CLIP-qRT-PCR to examine binding of ZBTB48 to MTA1 transcripts in HCT-116 cells. Control IPs were performed using IgG. HPRT1 was used as a negative control. Right: CLIP-qPCR to examine binding of FTO to MTA1 transcripts in siNT or siZBTB48 HCT-116 cells. Data are represented as % input. E Bar plot showing the relative m6A levels for MTA1 transcripts estimated using m6A-RIP-qPCR in ZBTB48 knockdown (left), siFTO (right), or siNT-treated HCT-116 cells. Data are represented as % input. F qRT-PCR analysis of MTA1 mRNA in siZBTB48 or siNT-treated HCT-116 cells after treating cells with Actinomycin D for the indicated times. G Western blotting analysis in whole cell lysates prepared from either ZBTB48 KD or control cells. ZBTB48 KD was carried out using two different siRNAs, i.e., siZBTB48 #1 and #2 (third and fourth lanes, respectively). Blots were probed with the indicated antibodies. H qRT-PCR analysis of MTA1 mRNA in cells treated with siNT, siZBTB48 (siRNA#2), siIGF2BP2 (siRNA#2), or a combination of siZBTB48 and siIGF2BP2. For each time point, relative transcript levels were normalized to 18S rRNA and time point “0”. I Wound healing assay using ZBTB48-knockdown or control cells was recorded and quantitatively analyzed (right) (∗p ≤ 0.05, two-way ANOVA). Note: For all qPCR experiments: at least 3 biological replicates, student’s t-test, ∗∗∗p ≤ 0.001, ∗∗p ≤ 0.01, ∗p ≤ 0.05, n.s.: non-significant, error bars denote SEM. See also Additional file 1: Fig. S11 and S12.

