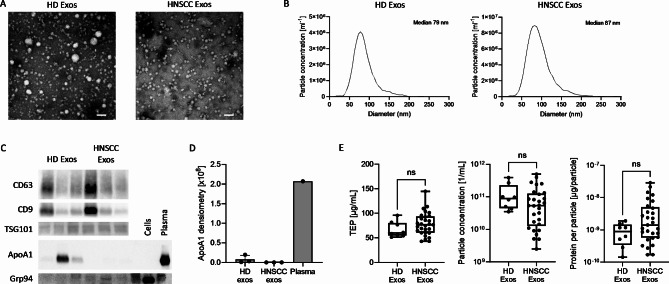
Fig. 1.
Characterization of plasma exosomes. (A) Representative transmission electron microscopy images and (B) size distribution profiles of exosomes from plasma of a healthy donor (HD) and a patient with head and neck squamous cell carcinoma (HNSCC). Scale bar = 100 nm. (C) Representative western blot images from plasma-derived exosomes. (D) Quantification of ApoA1 band intensity from (C). (E) Comparison of total exosome protein (TEP), particle concentration and protein per particle between n = 8 HD and n = 29 HNSCC patients. Box-and-whiskers show median, 25th and 75th quartiles and range. ns = not significant, as determined by Mann-Whitney test

