Fig. 2.
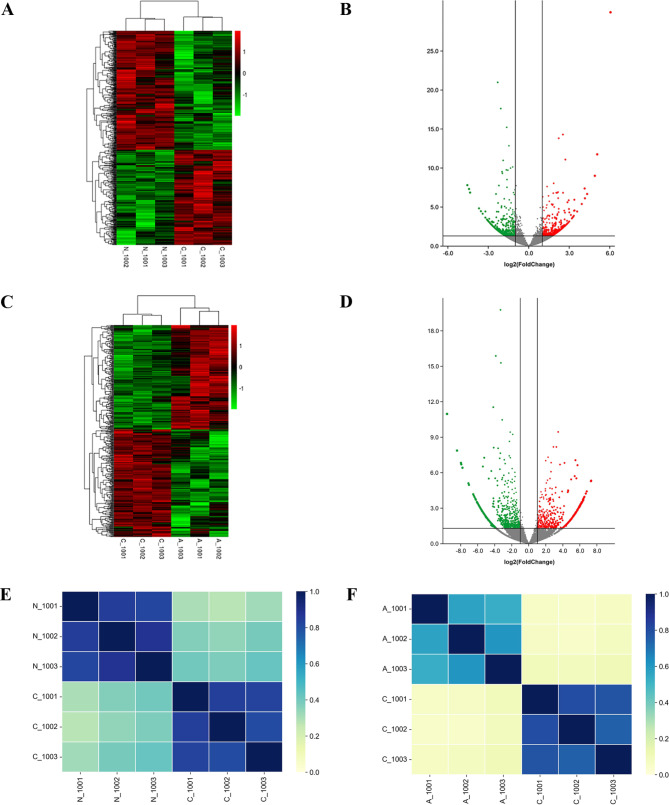
Profile of circRNA expression in CML. a Differentially expressed circRNA heatmap between CML-CP patients and HCs. b Volcano plot of differentially expressed circRNAs between CML-CP patients and HCs. c Differentially expressed circRNA heatmap between CML-CP and CML-AP/BP patients. d Volcano plot of differentially expressed circRNAs between CML-CP and CML-AP/BP patients. e Relevant heatmap results between CML-CP patients and HCs. f Relevant heatmap results between CML-CP and CML-AP/BP patients. Note: a, c On the left, circRNAs are clustered according to expression similarity. At the top of the figure, each sample is clustered according to the similarity of the expression spectrum, with the clustering intensity increasing from green to red. b, d The two vertical black lines represent twofold up- and downregulation, and the horizontal black lines symbolize a p value of 0.05. e, f The relative intensity increased from yellow to blue. N_1001, N_1002, and N_1003 represent 3 HCs; C_1001, C_1002, and C_1003 represent 3 CML-CP patients; and A_1001, A_1002, and A_1003 represent 3 CML-AP/BP patients

