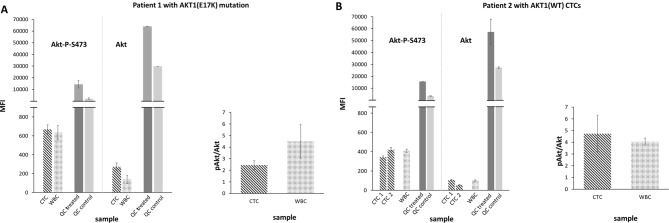
Fig. 6.
Measuring pAkt to Akt protein in single CTCs derived from two index MBC patients. (A) (left) RPPA Zeptosens analysis of pAkt and Akt protein signals (MFI) in single CTC and WBC samples derived from index patient 1 harboring an Akt1(E17K) mutation, in addition to co-printed quality control samples (QC treated, QC control); (right) pAkt/Akt mean signal ratios of respective patient 1 single CTC and WBC samples. (B) (left) RPPA Zeptosens analysis of pAkt and Akt protein signals (MFI) in single CTCs and WBCs from index patient 2 (wild type); (right) pAkt/Akt mean signal ratios of respective patient 2 single CTC and WBC samples

