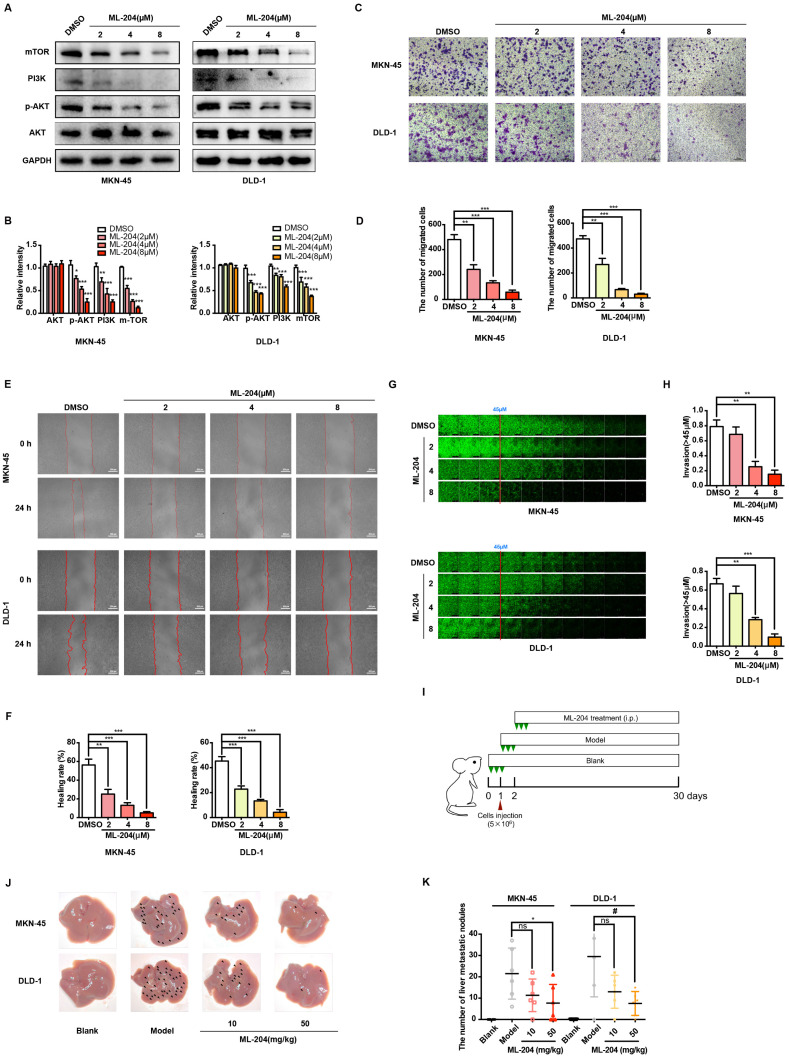
Figure 3.
Functional TRPC5 is critical for gastrointestinal cancer metastasis. (A, B) Immunoblot analysis of AKT, p-AKT, PI3K, and mTOR expression in MKN-45 and DLD-1 cells treated with ML-204 (2, 4, and 8 μM). Data are expressed as means ± SD, *P < 0.05, **P < 0.01, ***P < 0.001 (vs. DMSO group). (C) Representative images of MKN-45 and DLD-1 cell migration treated with ML-204 (2, 4, and 8 μM) in the transwell migration assay. Random visual fields were selected. Scale bar: 500 μm. (D) Bar graph showing the number of migrated MKN-45 and DLD-1 cells after ML-204 treatment (2, 4, and 8 μM). Data are expressed as means ± SD, **P < 0.01, ***P < 0.001 (vs. DMSO group). (E) Representative wound healing assay images of MKN-45 and DLD-1 cells treated with ML-204 (2, 4, and 8 μM). (F) Healing rates of MKN-45 and DLD-1 cells after ML-204 treatment. **P < 0.01, ***P < 0.001 (vs. DMSO group). (G) Inverted invasion assay evaluating MKN-45 and DLD-1 cell invasion in the presence of ML-204 (2, 4, and 8 μM). Scale bar: 250 μm. (H) Quantification of relative invasion abilities of MKN-45 and DLD-1 cells over 45 μm (n = 3). Data are expressed as means ± SD, **P < 0.01, ***P < 0.001 (vs. DMSO group). (I) Schematic of animal study: 5 × 10⁶ MKN-45 or DLD-1 cells were injected into BALB/c nude mice, followed by intraperitoneal injection of ML-204 (10 mg/kg and 50 mg/kg) starting on day 2 post-injection (n = 8 per group). (J, K) Liver metastasis analysis after engraftment of MKN-45 or DLD-1 cells. Data are expressed as means ± SD, *P < 0.05 (vs. MKN-45 model group), #P < 0.05 (vs. DLD-1 model group).

