Figure 5.
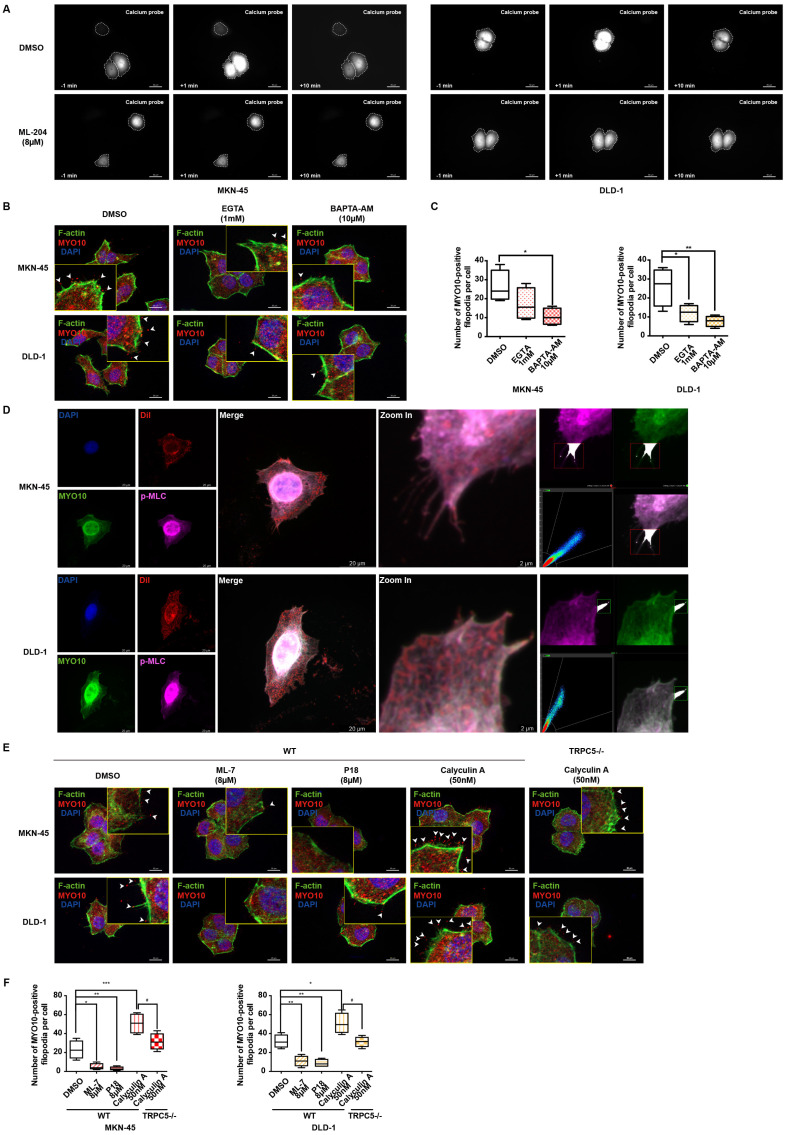
TRPC5 promotes filopodia formation via Ca2+-dependent MLC activation. (A) MKN-45 and DLD-1 cells expressing the calcium probe (GCaMP6s) were pretreated with DMSO or ML-204 (8 μM) before stimulation with Gd3+. The relative increase in intracellular calcium probe intensity was measured at 1 and 10 minutes post-stimulation, with cell boundaries indicated by dotted lines. Scale bar: 50 μm. (B) Representative MYO10 immunofluorescence (IF) staining in MKN-45 and DLD-1 cells treated with EGTA (1 mM) or BAPTA-AM (10 μM) (blue: nuclei, red: MYO10, green: F-actin). Scale bar: 20 μm. (C) Quantification of MYO10-positive filopodia in MKN-45 and DLD-1 cells treated with EGTA (1 mM) or BAPTA-AM (10 μM). Data are expressed as means ± SD, *P < 0.05, **P < 0.01 (vs. DMSO group). (D) Representative IF staining of MKN-45 and DLD-1 cells (blue: nuclei, red: dil, green: MYO10, violet: p-MLC). Scale bar: 20 μm (left). Zoomed-in images and fluorescence co-localization of p-MLC and MYO10 at filopodia tips in MKN-45 and DLD-1 cells (MKN-45: Pearson > 0.9; DLD-1: Pearson > 0.9). Scale bar: 2 μm (right). (E) Representative MYO10 IF staining of MKN-45 and DLD-1 cells treated with Calyculin A (50 nM), ML-7 (8 μM), or P18 (8 μM) (blue: nuclei, red: MYO10, green: F-actin). Scale bar: 20 μm. (F) Quantification of MYO10-positive filopodia in MKN-45 and DLD-1 cells treated with Calyculin A (50 nM), ML-7 (8 μM), or P18 (8 μM). Data are expressed as means ± SD, *P < 0.05, **P < 0.01, ***P < 0.001 (vs. DMSO group).

