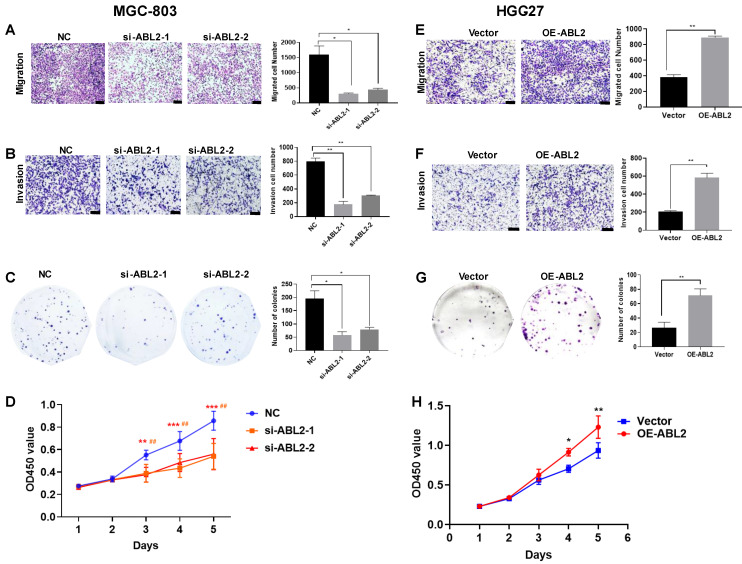
Figure 2.
High expression of ABL2 promoted cell migration, invasion and proliferation in GC cells. (A) Left, Images of trans-membrane cells in the NC and si-ABL2 group of MGC-803 cells (scale bars = 200 μm). Right, Quantitative analysis of trans-membrane cells; (B) Left, Images of invading membrane cells in the NC and si-ABL2 group of MGC-803 cells (scale bars = 200 μm). Right, Quantitative analysis of invading membrane cells; (C) Left, Images of cell colonies in the NC and si-ABL2 group of MGC-803 cells. Right, Quantitative analysis of cell colonies. (D) CCK-8 assay detected the effects of low expression of ABL2 on cell growth ability of MGC-803 cells. (E) Left, Images of transmembrane cells in Vector and OE-ABL2 groups HGC-27 cells (scale bars = 200 μm). Right, Quantitative analysis of transmembrane cells; (F) Left, Images of invading membrane cells in Vector and OE-ABL2 groups HGC-27 cells (scale bars = 200 μm). Right, Quantitative analysis of invading membrane cells; (G) Left, Images of cell colonies in Vector and OE-ABL2 groups HGC-27 cells. Right, Quantitative analysis of cell colonies. (H) CCK-8 assay examined the effect of high ABL2 expression in HGC-27 cells on cell growth ability when compared with the Vector group. Data are presented as the mean ± SD of 3 independent experiments. *P<0.05, **P<0.01, ***P<0.001; ##P<0.01, in CCK-8 si-ABL2-2 vs NC group.

