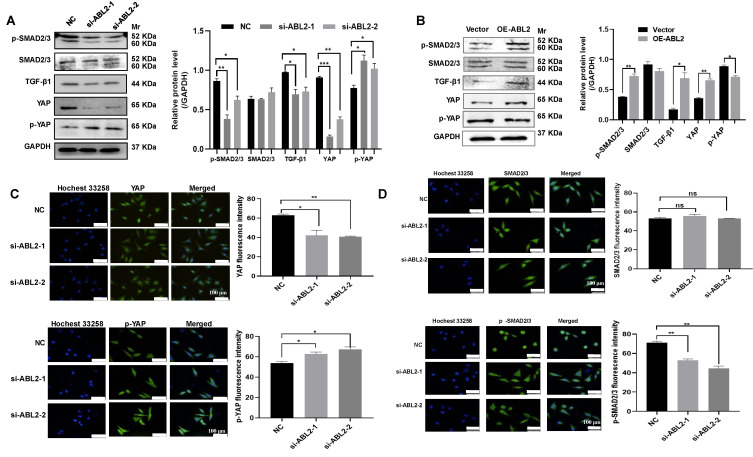
Figure 4.
ABL2 expression affected TGF-β/SMAD2/3 and YAP signaling pathway related proteins. (A and B) Left, Representative image shown the expression of TGF-β1 and YAP signaling pathway related proteins in MGC-803cells (A) and HGC-27 cells (B) with knocked down or overexpressed ABL2 expression. Right, Quantitative analysis of the relative protein expression levels. (C) Left, Representative image of cell fluorescence showing that knockdown of ABL2 in MGC-803 cells decreases YAP expression and increases p-YAP expression (scale bars = 100 μm). Right, Quantitative analysis of the mean fluorescent intensity levels. (D) Left, Representative image of cell fluorescence indicating that knockdown of ABL2 in MGC-803 cells decreases p-SMAD2/3 expression (scale bars = 100 μm). Right, Quantitative analysis of the mean fluorescent intensity levels. Data are presented as the mean ± SD of 3 independent experiments. *P<0.05, **P<0.01, ***P<0.001.

