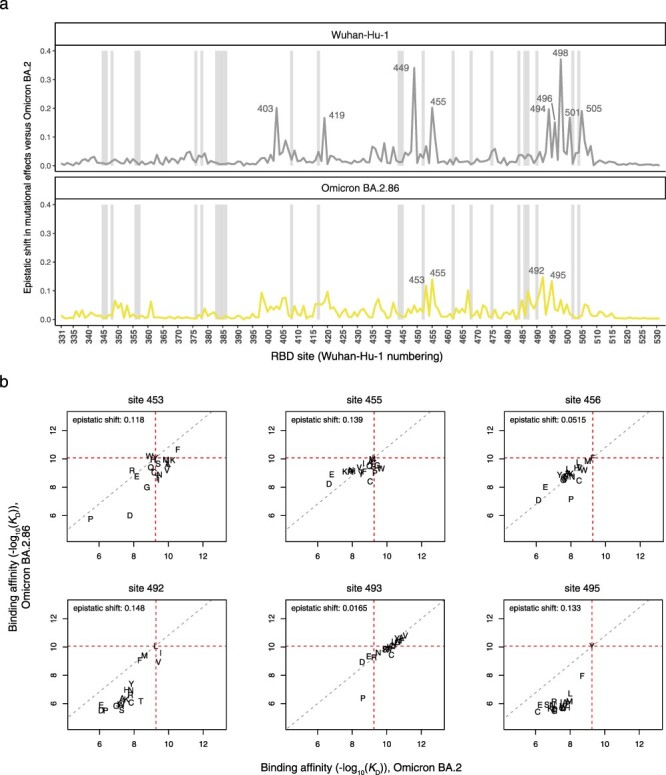
Figure 3.

Epistatic shifts in mutational effects on ACE2 binding. (a) Epistatic shift in the effects of mutations on ACE2 binding at each RBD position as measured in the Wuhan-Hu-1 [previously reported in (Starr et al. 2022a)] or BA.2.86 background compared to those previously measured in Omicron BA.2 (Starr et al. 2022b). Shaded gray bars indicate sites of strong antibody escape, as defined in Fig. 2A. (b) Mutation-level plots of epistatic shifts between BA.2 and BA.2.86 at sites of interest. Each scatterplot shows the measured ACE2-binding affinity of each amino acid (plotting character) in the BA.2.86 versus BA.2. backgrounds. Horizontal and vertical red dashed lines mark the wildtype RBD affinities on each axis, and the diagonal gray dashed line indicates the additive (non-epistatic) expectation. Interactive plots enabling the comparison of all SARS-CoV-2 variants and scatterplots for all RBD sites are available at https://tstarrlab.github.io/SARS-CoV-2-RBD_DMS_Omicron-EG5-FLip-BA286/epistatic-shifts/.
