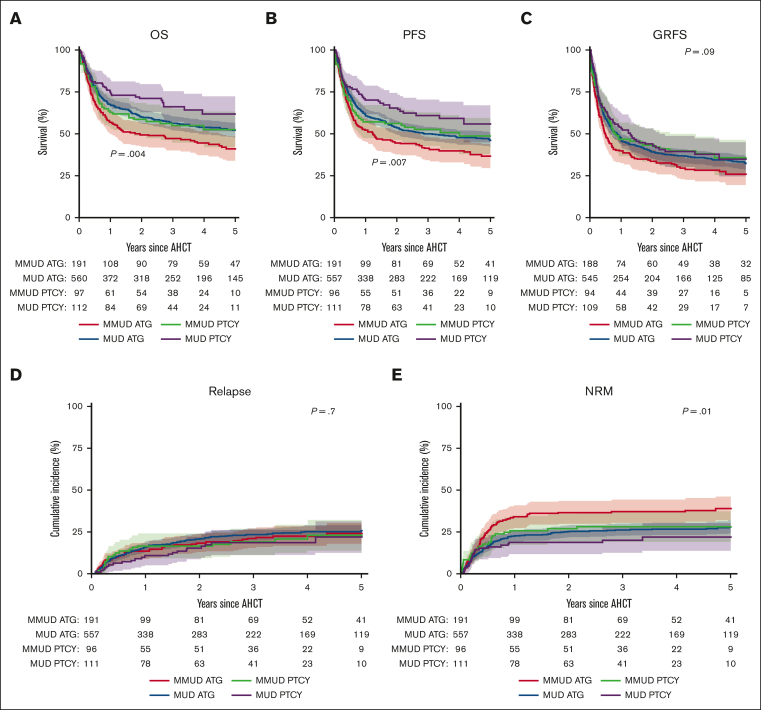
Figure 3.
Outcomes of patients with MDS transplanted with PTCY vs ATG. (A) OS was 60% (95% CI, 52-72) for patients who underwent a MUD transplant and received PTCY, 53% (95% CI, 42-63) for patients who underwent a MMUD transplant and received PTCY, 52% (95% CI, 48-57) for patients who underwent a MUD transplant and received ATG, and 41% (95% CI, 34-49) for patients who underwent a MMUD transplant and received ATG (P = .004). (B) PFS was 56% (95% CI, 45-67) for patients who underwent a MUD transplant and received PTCY, 49% (95% CI, 38-60) for patients who underwent a MMUD transplant and received PTCY, 46% (95% CI, 42-51) for patients who underwent a MUD transplant and received ATG, and 37% (95% CI, 30-44) for patients who underwent a MMUD transplant and received ATG (P = .007). (C) GRFS was 35% (95% CI, 25-45) for patients who underwent a MUD transplant and received PTCY, 36% (95% CI, 25-46) for patients who underwent a MMUD transplant and received PTCY, 32% (95% CI, 28-37) for patients who underwent a MRD transplant and received ATG, and 26% (95% CI, 19-33) for patients who underwent a MMUD transplant and received ATG (P = .09). (D) RI was 22% (95% CI, 12-31) for patients who underwent a MUD transplant and received PTCY, 23% (95% CI, 14-32) for patients who underwent a MMUD transplant and received PTCY, 26% (95% CI, 22-29) for patients who underwent a MUD transplant and received ATG, and 24% (95% CI, 18-31) for patients who underwent a MMUD transplant and received ATG (P = .7). (E) NRM was 22% (95% CI, 14-30) for patients who underwent a MUD transplant and received PTCY, 28% (95% CI, 19-37) for patients who underwent a MMUD transplant and received PTCY, 28% (95% CI, 24-32) for patients who underwent a MUD transplant and received ATG, and 39% (95% CI, 32-46) for patients who underwent a MMUD transplant and received ATG (P = .009) when stratified by donor type (MUD vs MMUD). Numbers below the graph show the number of patients at risk.

