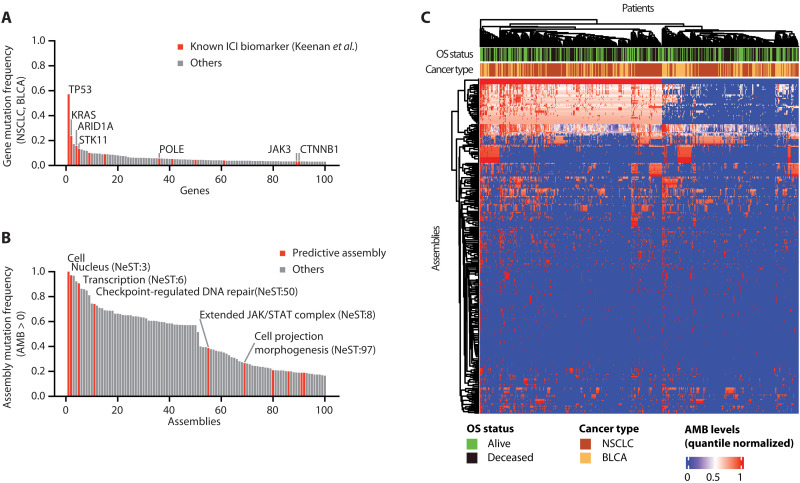
Fig. 2. Local mutational burdens converge on protein assemblies.
(A) Mutation frequencies of the top 100 most frequently altered genes in the Samstein BLCA and NSCLC cohorts (N = 555). Previously reported ICI biomarkers curated by Keenan et al. (22) are shown in red. (B) Mutation frequencies of the top 100 most frequently altered protein assemblies in the same cohorts as (A). Assemblies predictive of ICI response are shown in red. (C) AMB landscape for all 394 assemblies (rows) across 555 tumor samples (columns) from the Samstein cohort. AMBs for each assembly are quantile normalized, with a blue-to-red color scale indicating low to high mutation burdens, respectively. Overall survival (OS) status is also shown (green and black indicating alive and deceased, respectively). Hierarchical clustering is applied to both rows and columns, with corresponding dendrograms shown.

