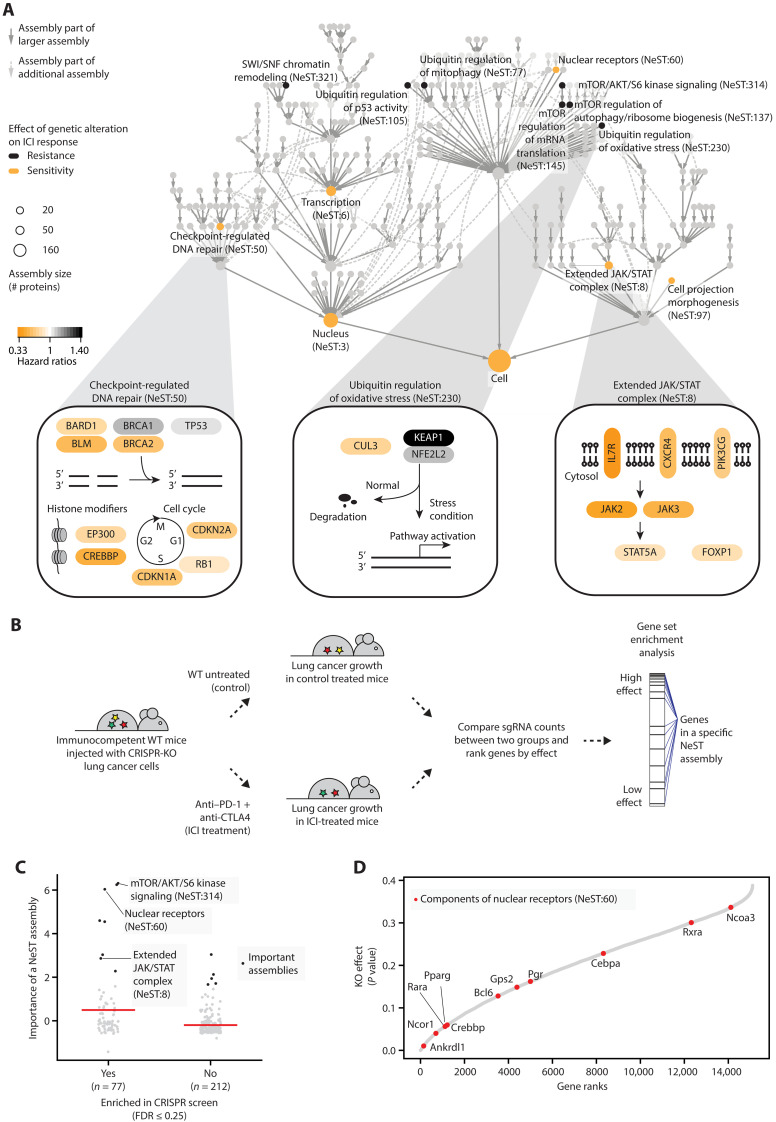
Fig. 4. Important protein assemblies in ICI response prediction.
(A) The hierarchy shows the NeST compendium of protein assemblies (33). Nodes represent assemblies, and node size indicates assembly size in a number of proteins. Colors indicate assemblies scoring as important for ICI response prediction, with black and yellow indicating resistance and sensitivity, respectively. Edges indicate containment relationships (of one assembly by another) whereby a smaller assembly occurs within a larger one. Three predictive assemblies are detailed at the bottom. For each gene, the yellow-to-black color scale is based on the importance of genetic alterations to that gene in the Samstein dataset, determined using the hazard ratio of resistance. Pathway figures are adapted from NDEx IQuery (71, 72). (B) In vivo CRISPR screening of genome-wide gene knockouts (KO; for each of 15,105 genes) in lung cancer cells injected in immunocompetent mice (37). Mice were grouped by anti–PD-1 plus anti-CTLA4 treatment or no immunotherapy treatment to measure the effects of gene KO on immunotherapy efficacy. WT, wild type. (C) Comparison of model importance scores between NeST assemblies enriched or not enriched in in vivo CRISPR screening. Black dots indicate important assemblies. Red horizontal bars indicate mean importance scores. FDR, false discovery rate. (D) KO effects of NeST:60 components (red dots). Genes are ranked by their KO effects on tumor growth, where a lower rank indicates a higher effect.

