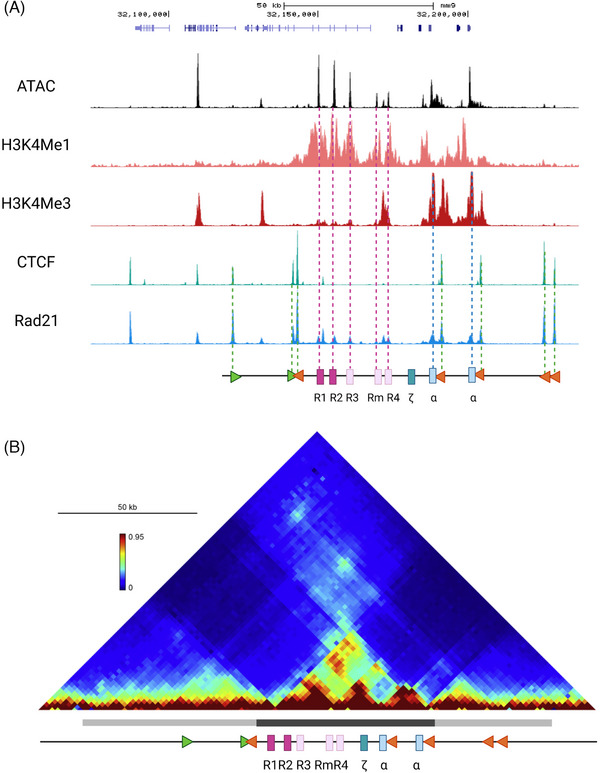
FIGURE 2.

The α‐globin locus regulatory domain. (A) At the top, UCSC track representing the α‐globin locus (coordinates [mm9]: 32 120 000–32 200 000). Middle, the regulatory elements of the α‐globin locus are indicated by accessible chromatin (Assay for Transposase‐Accessible Chromatin using sequencing: ATAC‐seq) and Chromatin Immunoprecipitation followed by sequencing (ChIP‐seq) tracks for H3K4me1 marking the enhancers (dark and light pink rectangles), H3K4me3 indicating the promoters (light blue rectangles), CTCF binding pattern corresponding to the CTCF sites (green and orange triangles), and Rad21 binding across the locus. Bottom, a schematic representation of the locus with the elements represented as described above and specifically the enhancers R1 and R2 and facilitators R3, Rm and R4 as well as the embryonic (ζ) and adult α‐globin genes indicated. (B) Chromatin conformation capture (3C, Tiled‐C Capture) contact matrix covering 200 kb spanning the mouse α‐globin cluster (coordinates [mm9]: 32 060 000–32 260 000) with the higher intensity colours reflecting the higher frequency of contact between the α‐globin major cis‐regulatory elements and delineating the sub‐TAD (dark grey bar under the matrix), and contacts established between the convergent CTCF sites marking the span of the TAD (light grey bar under the matrix), both structures aligned to the schematic of the locus below.
