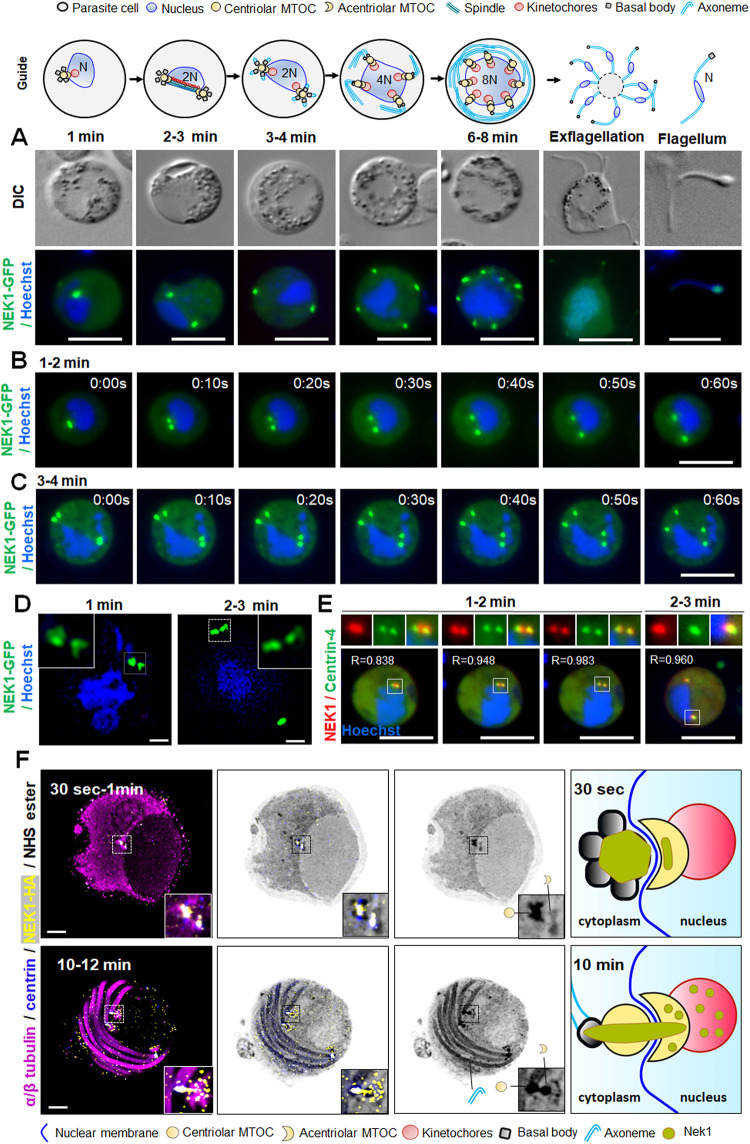
Fig 2. The location of NEK1, centrin and tubulin during basal body formation and axoneme assembly in male gametogenesis.
(A) Live cell imaging of NEK1-GFP (green) during male gametogenesis showing foci in gametocytes at different time points after gametocyte activation and in the free male gamete (flagellum). Panels are DIC, differential interference contrast, and merged, Hoechst (blue, DNA), NEK1-GFP (green). More than 50 images were analysed in more than 5 different experiments for each time point. Scale bar = 5 μm. The guide shows a schematic of gametogenesis with various structures indicated in both nucleus and cytoplasm. In the cytoplasm the centriolar MTOC has associated basal bodies and organises axoneme formation; adjacent in the nucleus the acentriolar MTOC has associated kinetochores. N refers to the ploidy of the cell. (B) Stills from time lapse imaging showing split of NEK1-GFP focal point into 2 and their separation during the first round of mitosis at 1 to 2 min after gametocyte activation. More than 30 time lapses were analysed in more than 3 different experiments. Scale bar = 5 μm. (C) Stills from time lapse imaging showing the split of NEK1-GFP and their separation during the second round of mitosis at 3 to 4 min after gametocyte activation. More than 30 time lapses were analysed in more than 3 different experiments. Scale bar = 5 μm. (D) Super-resolution 3D-imaging of NEK1-GFP in gametocytes fixed at 1 and 2 to 3 min after activation. These are merged images of NEK1-GFP (green) and DNA (Hoechst, blue). The insets show a higher magnification of the boxed areas in the 2 panels. More than 10 images were analysed in more than 3 different experiments for each time point. Scale bar = 1 μm. (E) Live cell imaging showing location of NEK1-mCherry (red) in relation to centrin-4-GFP (green) in male gametocytes 1 to 3 min after activation. Pearson’s correlation coefficient (R-value) for overlap between the NEK1 and centrin signals usually exceeded 0.75. More than 20 images were analysed in more than 3 different experiments. Scale bar = 5 μm. (F) Expansion microscopy showing location of NEK1-HA (yellow), centrin (blue), and α/β tubulin (magenta) detected with specific antibodies. Amine reactivity with NHS-ester is shown in shades of grey. The boxed areas in panels correspond to the zoomed insets. Axonemes: A; cMTOC: centriolar MTOC; aMTOC: acentriolar MTOC; spindle microtubules: MT. The guide illustrates NEK1 location relative to the MTOC. More than 20 images were analysed in more than 3 different experiments for each time point. Scale bar = 5 μm.

