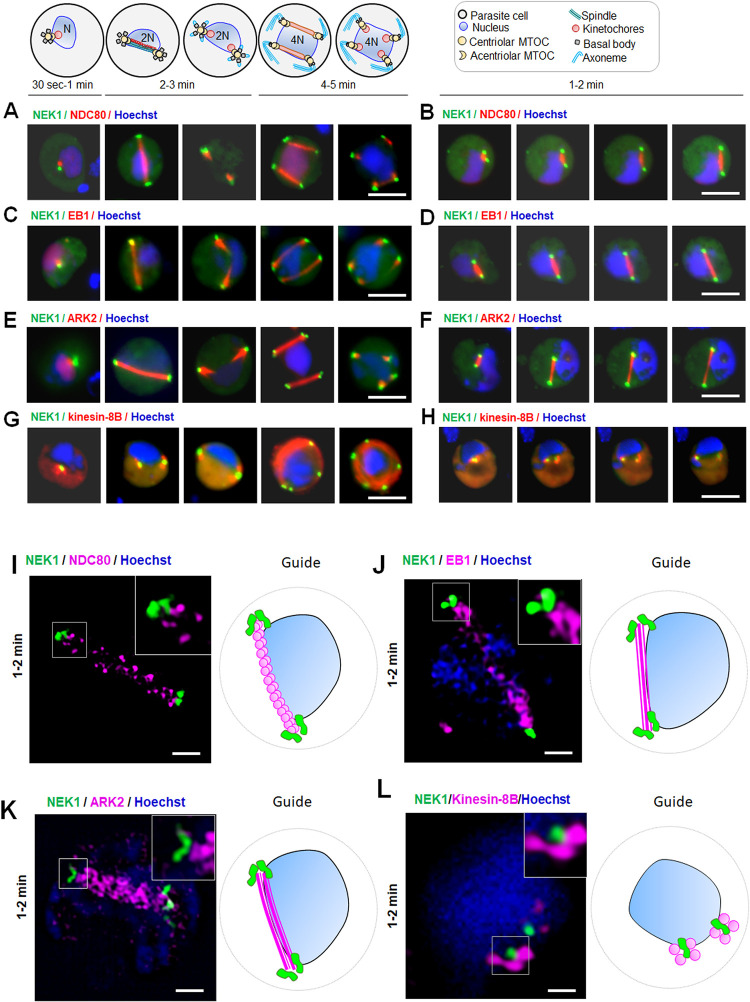
Fig 3. The location of NEK1 in relation to kinetochore (NDC80), nuclear spindle (ARK2 and EB1), and basal body (kinesin-8B) markers during chromosome segregation in male gametogenesis.
The guide illustrates structures associated with mitosis and axoneme formation. (A) Live cell imaging showing the dynamics of NEK1-GFP (green) in relation to kinetochore marker (NDC80-mCherry [red]) at different time points during gametogenesis. DNA is stained with Hoechst dye (blue). More than 50 images were analysed in more than 3 different experiments. Scale bar = 5 μm. (B) Stills from time lapse imaging showing the dynamics of NEK1-GFP (green) in relation to kinetochore/spindle marker (NDC80-mCherry [red]) after 1 to 2 min activation. DNA is stained with Hoechst dye (blue). More than 30 time lapses were analysed in more than 3 different experiments. Scale bar = 5 μm. (C) Live cell imaging showing the dynamics of NEK1-GFP (green) in relation to spindle marker (EB1-mCherry [red]) at different time points during gametogenesis. DNA is stained with Hoechst dye (blue). More than 50 images were analysed in more than 3 different experiments. Scale bar = 5 μm. (D) Stills from time lapse imaging showing the dynamics of NEK1-GFP (green) in relation to spindle marker (EB1-mCherry [red]) after 1 to 2 min activation. DNA is stained with Hoechst dye (blue). More than 30 time lapses were analysed in more than 3 different experiments. Scale bar = 5 μm. (E) Live cell imaging showing the dynamics of NEK1-GFP (green) in relation to spindle associated marker (ARK2-mCherry [red]) at different time points during gametogenesis. More than 50 images were analysed in more than 3 different experiments. Scale bar = 5 μm. (F) Stills from time lapse imaging showing the dynamics of NEK1-GFP (green) in relation to spindle associated marker (ARK2-mCherry [red]) after 1 to 2 min activation. DNA is stained with Hoechst dye (blue). More than 30 time lapses were analysed in more than 3 different experiments. Scale bar = 5 μm. (G) Live cell imaging showing location of NEK1-GFP (green) in relation to the basal body and axoneme marker, kinesin-8B-mCherry (red) at different time points during gametogenesis. NEK1, like kinesin-8B, has a cytoplasmic location and remains associated with basal bodies during their biogenesis and axoneme formation throughout gamete formation. More than 50 images were analysed in more than 3 different experiments. Scale bar = 5 μm. (H) Stills from time lapse imaging showing the dynamics of NEK1-GFP (green) in relation to kinesin-8B-mCherry (red) after 1- to 2-min activation. DNA is stained with Hoechst dye (blue). More than 30 time lapses were analysed in more than 3 different experiments. Scale bar = 5 μm. (I) Super-resolution 3D imaging of NEK1-GFP and NDC80-mCherry in gametocytes fixed at 1- to 2-min post activation. More than 10 images were analysed in more than 3 different experiments. Scale bar = 1 μm. The inset is a higher magnification of the boxed area on the main panel; the guide is a cartoon of the cell. (J) Super-resolution 3D imaging of NEK1-GFP and EB1-mCherry in gametocytes fixed at 1- to 2-min post activation. More than 10 images were analysed in more than 3 different experiments. Scale bar = 1 μm. The inset is a higher magnification of the boxed area on the main panel; the guide is a cartoon of the cell. (K) Super-resolution 3D imaging of NEK1-GFP and ARK2-mCherry in gametocytes fixed at 1- to 2-min post activation. More than 10 images were analysed in more than 3 different experiments. Scale bar = 1 μm. The inset is a higher magnification of the boxed area on the main panel; the guide is a cartoon of the cell. (L) Super-resolution 3D imaging of NEK1-GFP and kinesin-8B-mCherry in gametocytes fixed at 1- to 2-min post activation. More than 10 images were analysed in more than 3 different experiments. Scale bar = 1 μm. The inset is a higher magnification of the boxed area on the main panel; the guide is a cartoon of the cell.

