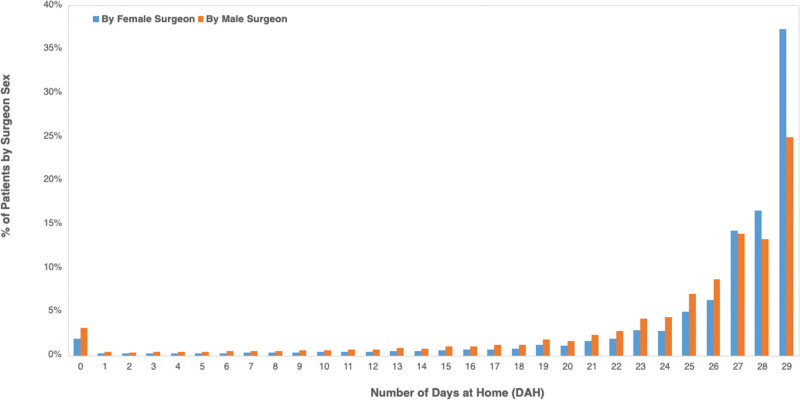
FIGURE 1.
Distribution of the patient-level number of days at home (DAH) within 30 days of index surgery, stratified by surgeon sex. For both male and female surgeons, the distribution of patients for each day up to 30 days at home is shown as a frequency (%) among the total number of patients operated on by the surgeon of that sex.

