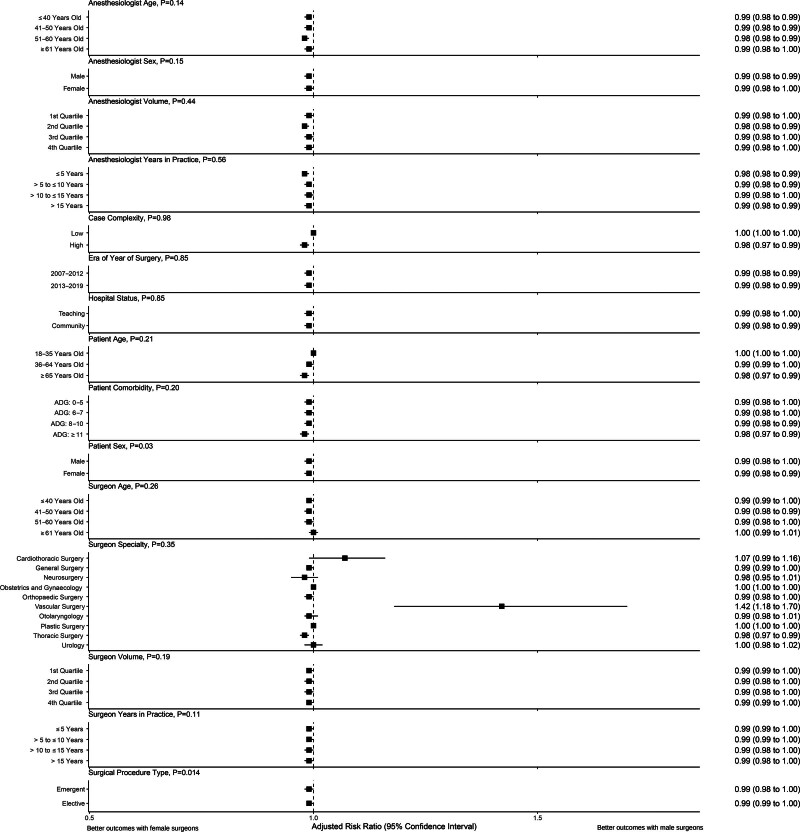
FIGURE 2.
Forest plot of subgroup analyses assessing the association between surgeon sex and number of days at home (DAH) within 90 days of index surgery, stratified by anesthesiologist, surgeon, patient, and procedural characteristics. P values correspond to the observed heterogeneity. ADG indicates ambulatory diagnosis groups.

