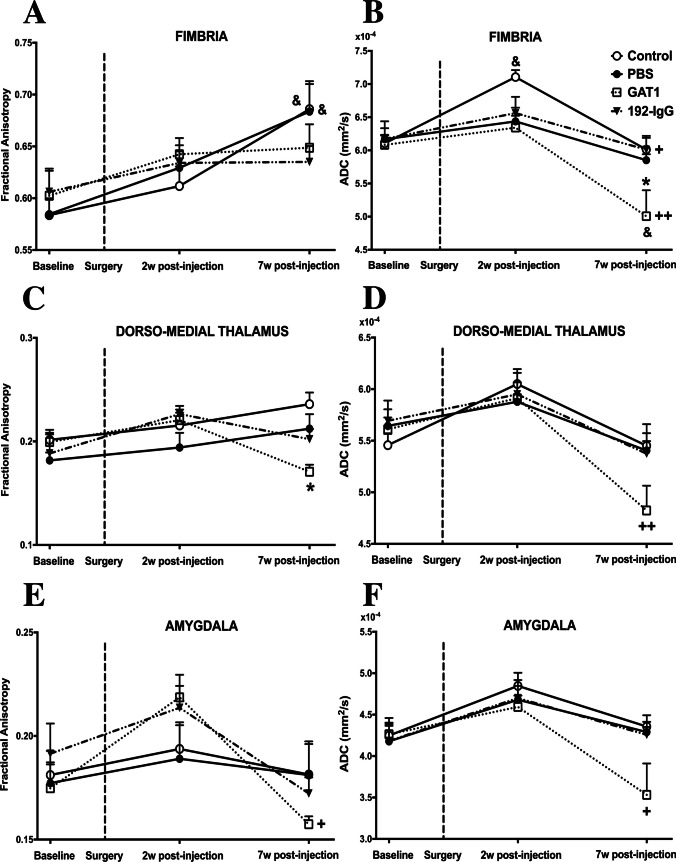
Fig. 6.
Fractional anisotropy (FA) and apparent diffusion coefficient (ADC) values from the fimbria, dorso-medial thalamus, and amygdala of control and lesioned rats. The graphs show the mean and standard error per group. The dotted line indicates the day of the surgery. A In the case of the fimbria, FA values from control and PBS groups show a pattern of increase over time; this effect was not observed when injecting the saporins. B When comparing ADC values, only control animals show a significant increase after 2 weeks of post-injection; moreover, the third time-point shows that GAT1-saporin-injected animals are the group with statistically significant changes (longitudinal and between groups). The GAT1-saporin injection into the medial septum also decreased FA and ADC values of the dorso-medial thalamus (C and D) and amygdala (E and F). Plus sign ( +), multiple comparisons two-way ANOVA; asterisk (*), post-hoc between group differences; ampersand (&), post-hoc within-group difference with respect to baseline (one or two symbols for p < 0.05 and 0.01, respectively). PBS, phosphate buffered saline; w, weeks

