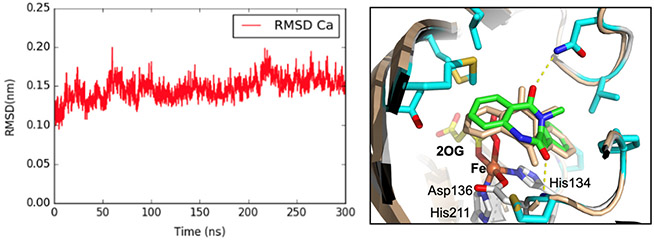
Fig. 5.
Left: RMSD Cα atoms of MD simulated AsqJ structure (relative to AsqJ crystal structure, PDB ID: 6K0E) during 300 ns production MD trajectories. Right: Structure overlay of MD simulated AsqJ structure in the presence of 2-H (wheat color) and the corresponding X-ray crystal structure (multi-color, PDB ID: 6K0E, (Li et al., 2020)). The figure highlights the overlay of the 2-H in the MD structure (wheat color) and in the crystal structure (green color).

