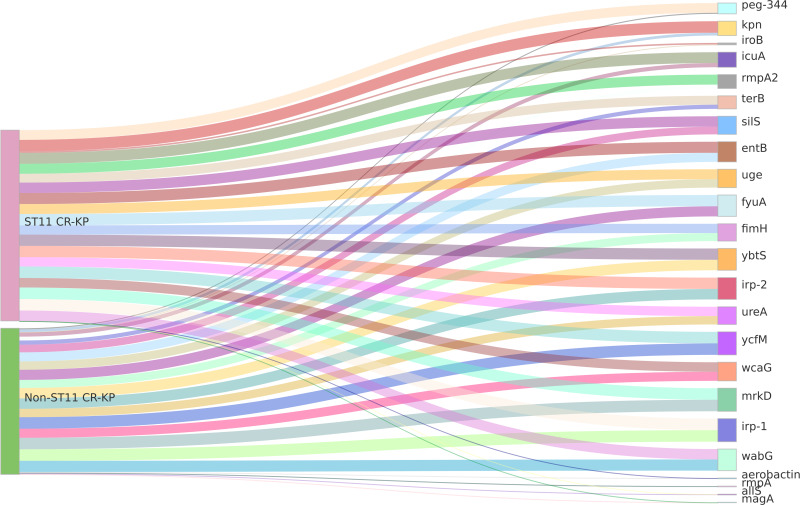
Figure 3.
Sankey Diagram of Virulence Genes in CR-KP. A Sankey diagram, also known as a Sankey energy flow chart, is used here. The left nodes represent ST11 and non-ST11 types of CR-KP, while the right nodes represent 23 common virulence genes. The diagram shows the flow from CR-KP types on the left to the virulence genes on the right, the width of the branches correlates with the number of virulence genes.

