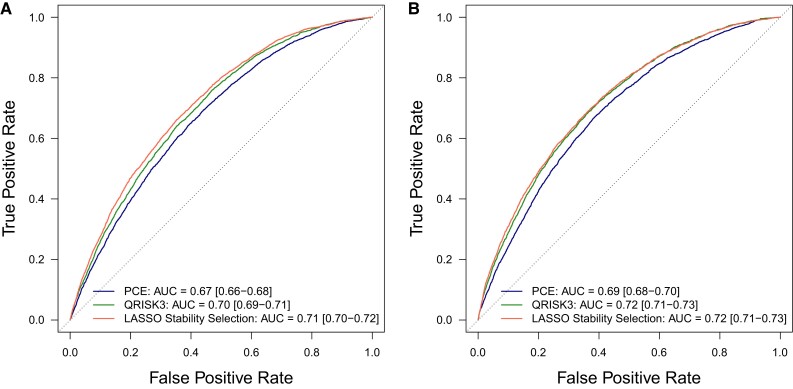
Figure 3.
CVD prediction in test data. ROC curves for logistic models predicting 10-year incident CVD in (N = 36 519) men (A) and (N = 54 792) women (B) in test data, where models use either recalibrated PCE (blue line), recalibrated QRISK3 (green line), or sex-specific stably selected variables (red line) in test data. We report the mean and 95% confidence intervals for the AUC.

