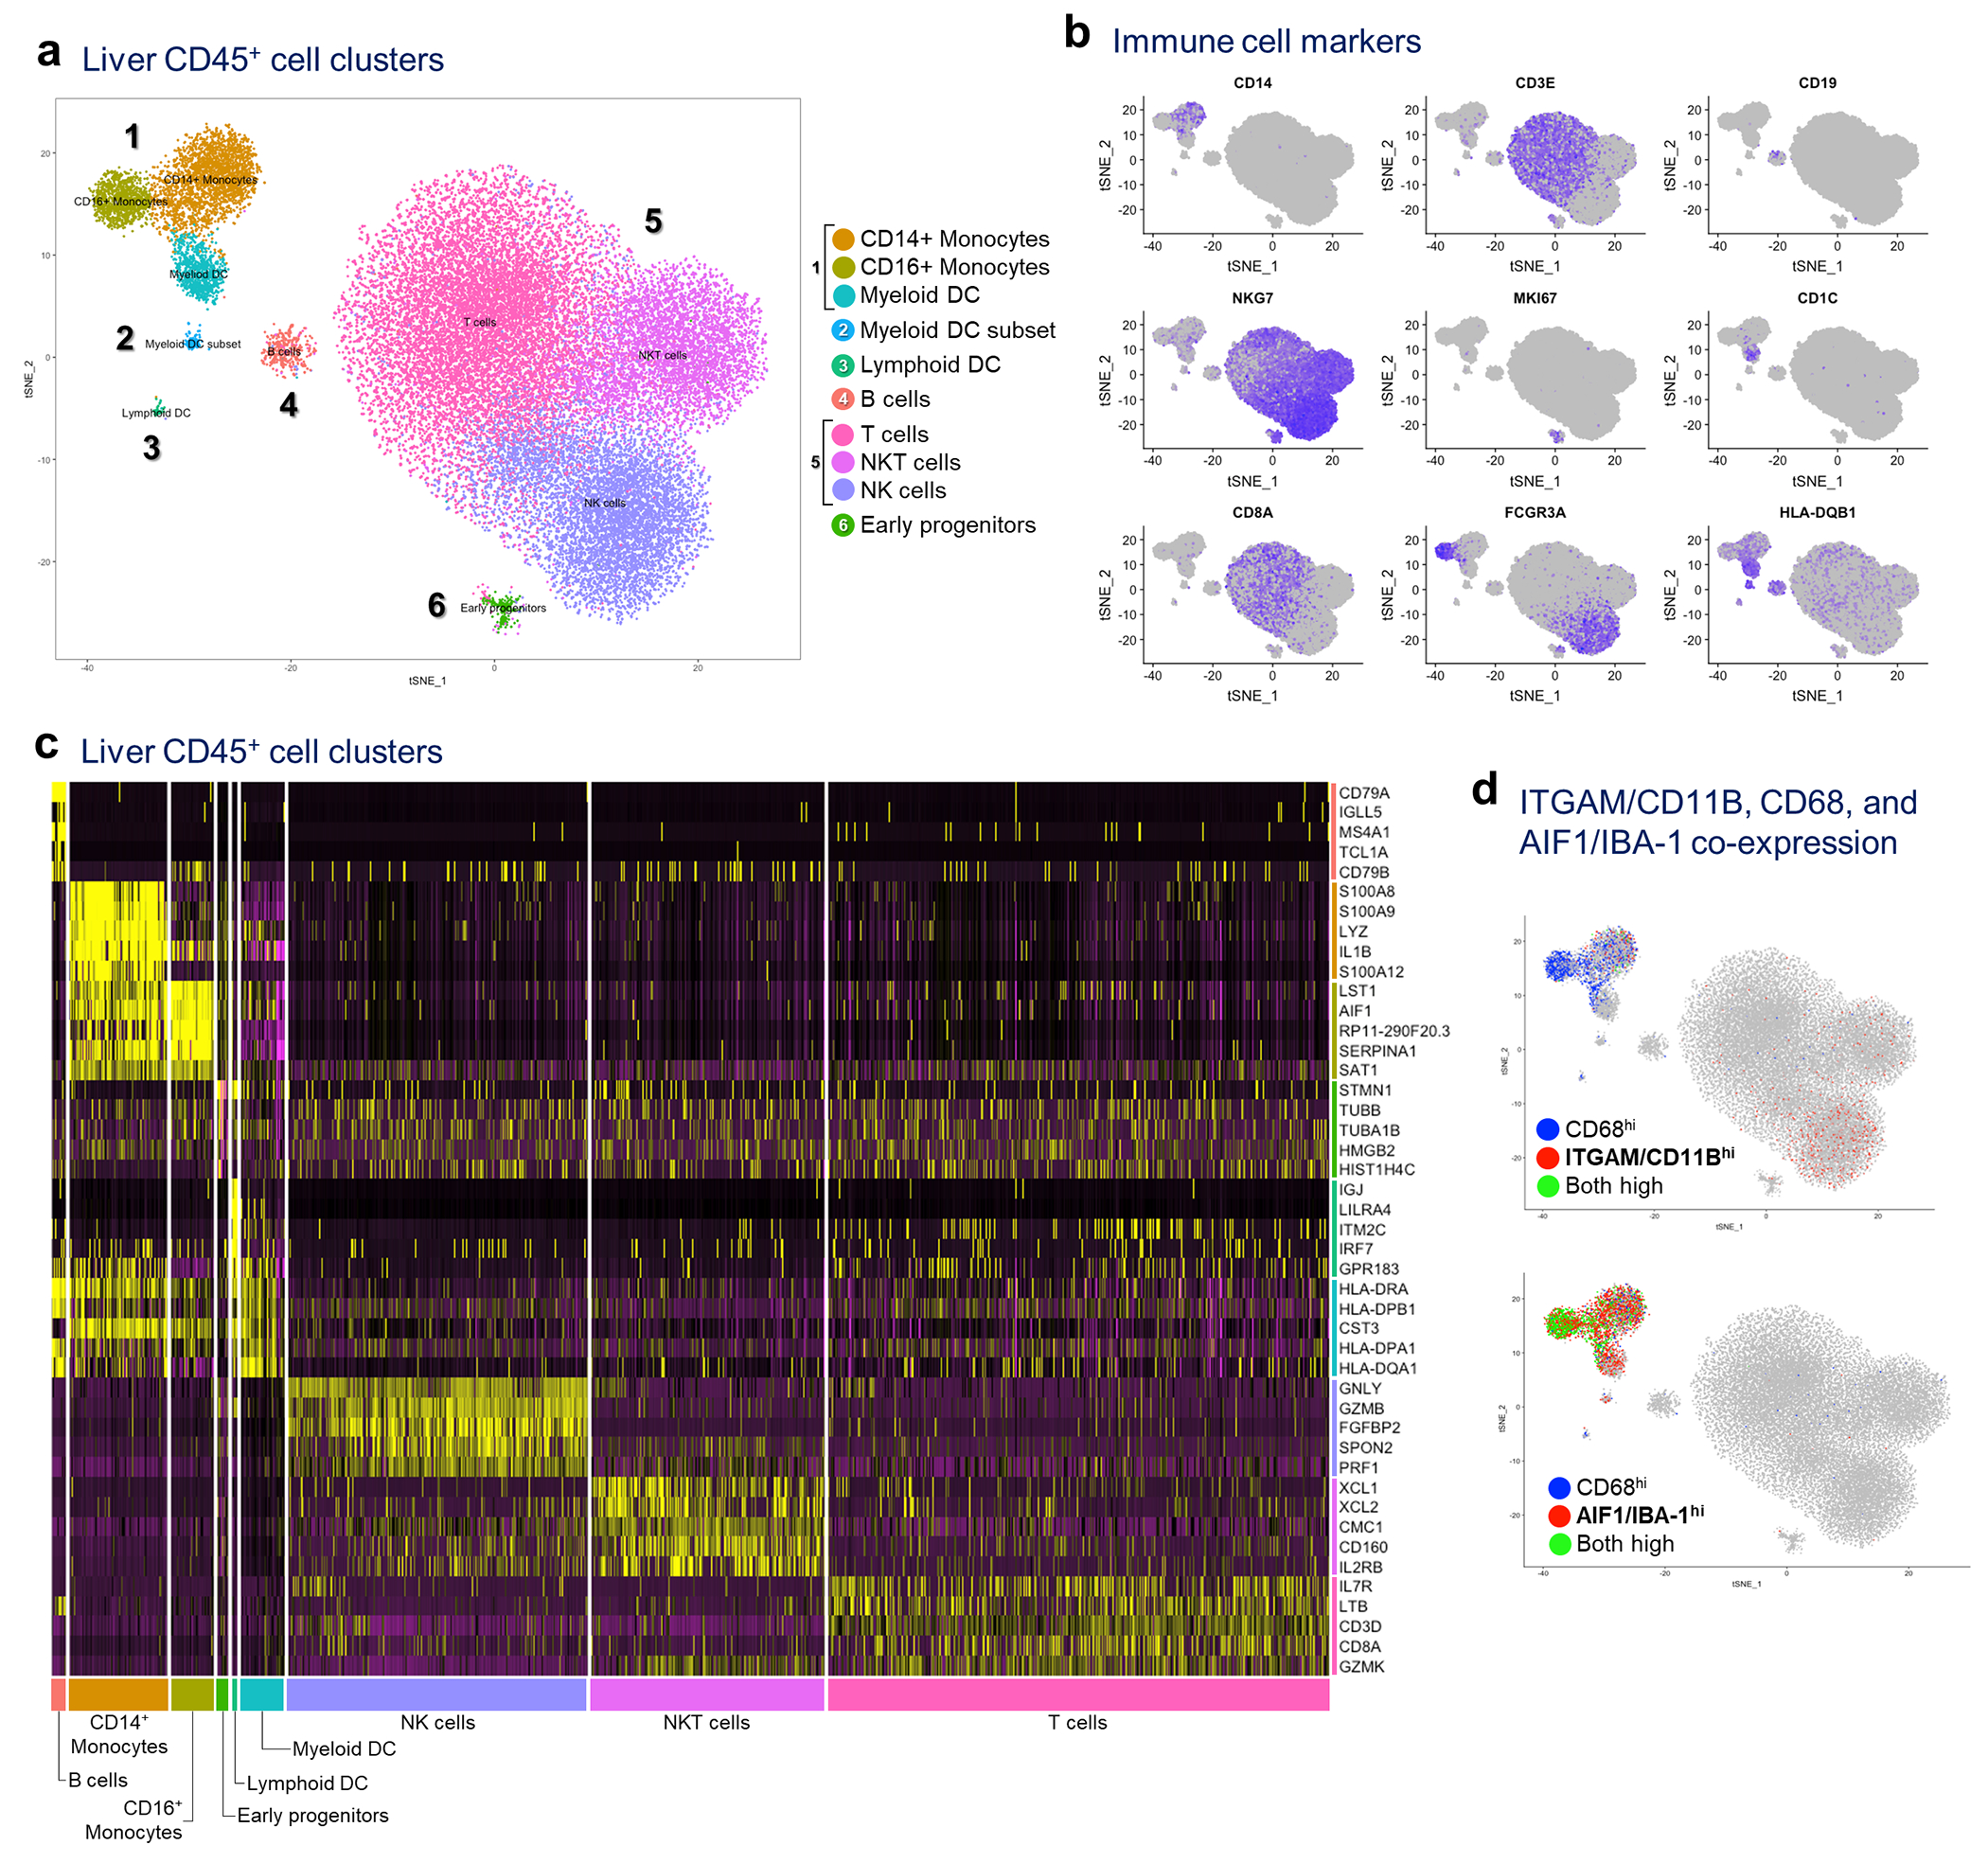
Extended Data Fig. 4 |. Single cell RNA sequencing (scRNAseq) of liver immune cells.

a, Hepatic NPCs (>95% CD45+) were isolated from 3 non-PaC and 5 PaC patients and subjected to scRNAseq. A total of 33,311 cells were sequenced, with 48,294 mean reads per cell and 1,000 median genes per cell detected. The sequencing saturation was >78% for all samples, a, tSNE plot combining all samples showing clustering into 10 major cell clusters, b, Distribution of gene expression of conventional immune cell markers further defining the different cell types, c, Heatmap of top 5 genes assigning the main cell types, d, Co-expression of CD11B/ITGAM, CD68, and IBA-1/AIF1 was assessed at the gene level, revealing CD1 IB expression predominantly by the CD14+ monocyte subset of the myeloid cluster and by the NK cell subset of the lymphoid cluster, showing little co-expression with CD68 (top tSNE plot). IBA-1 was expressed by all 3 subsets of the myeloid cluster, and most CD68-expressing cells (bottom tSNE plot).
