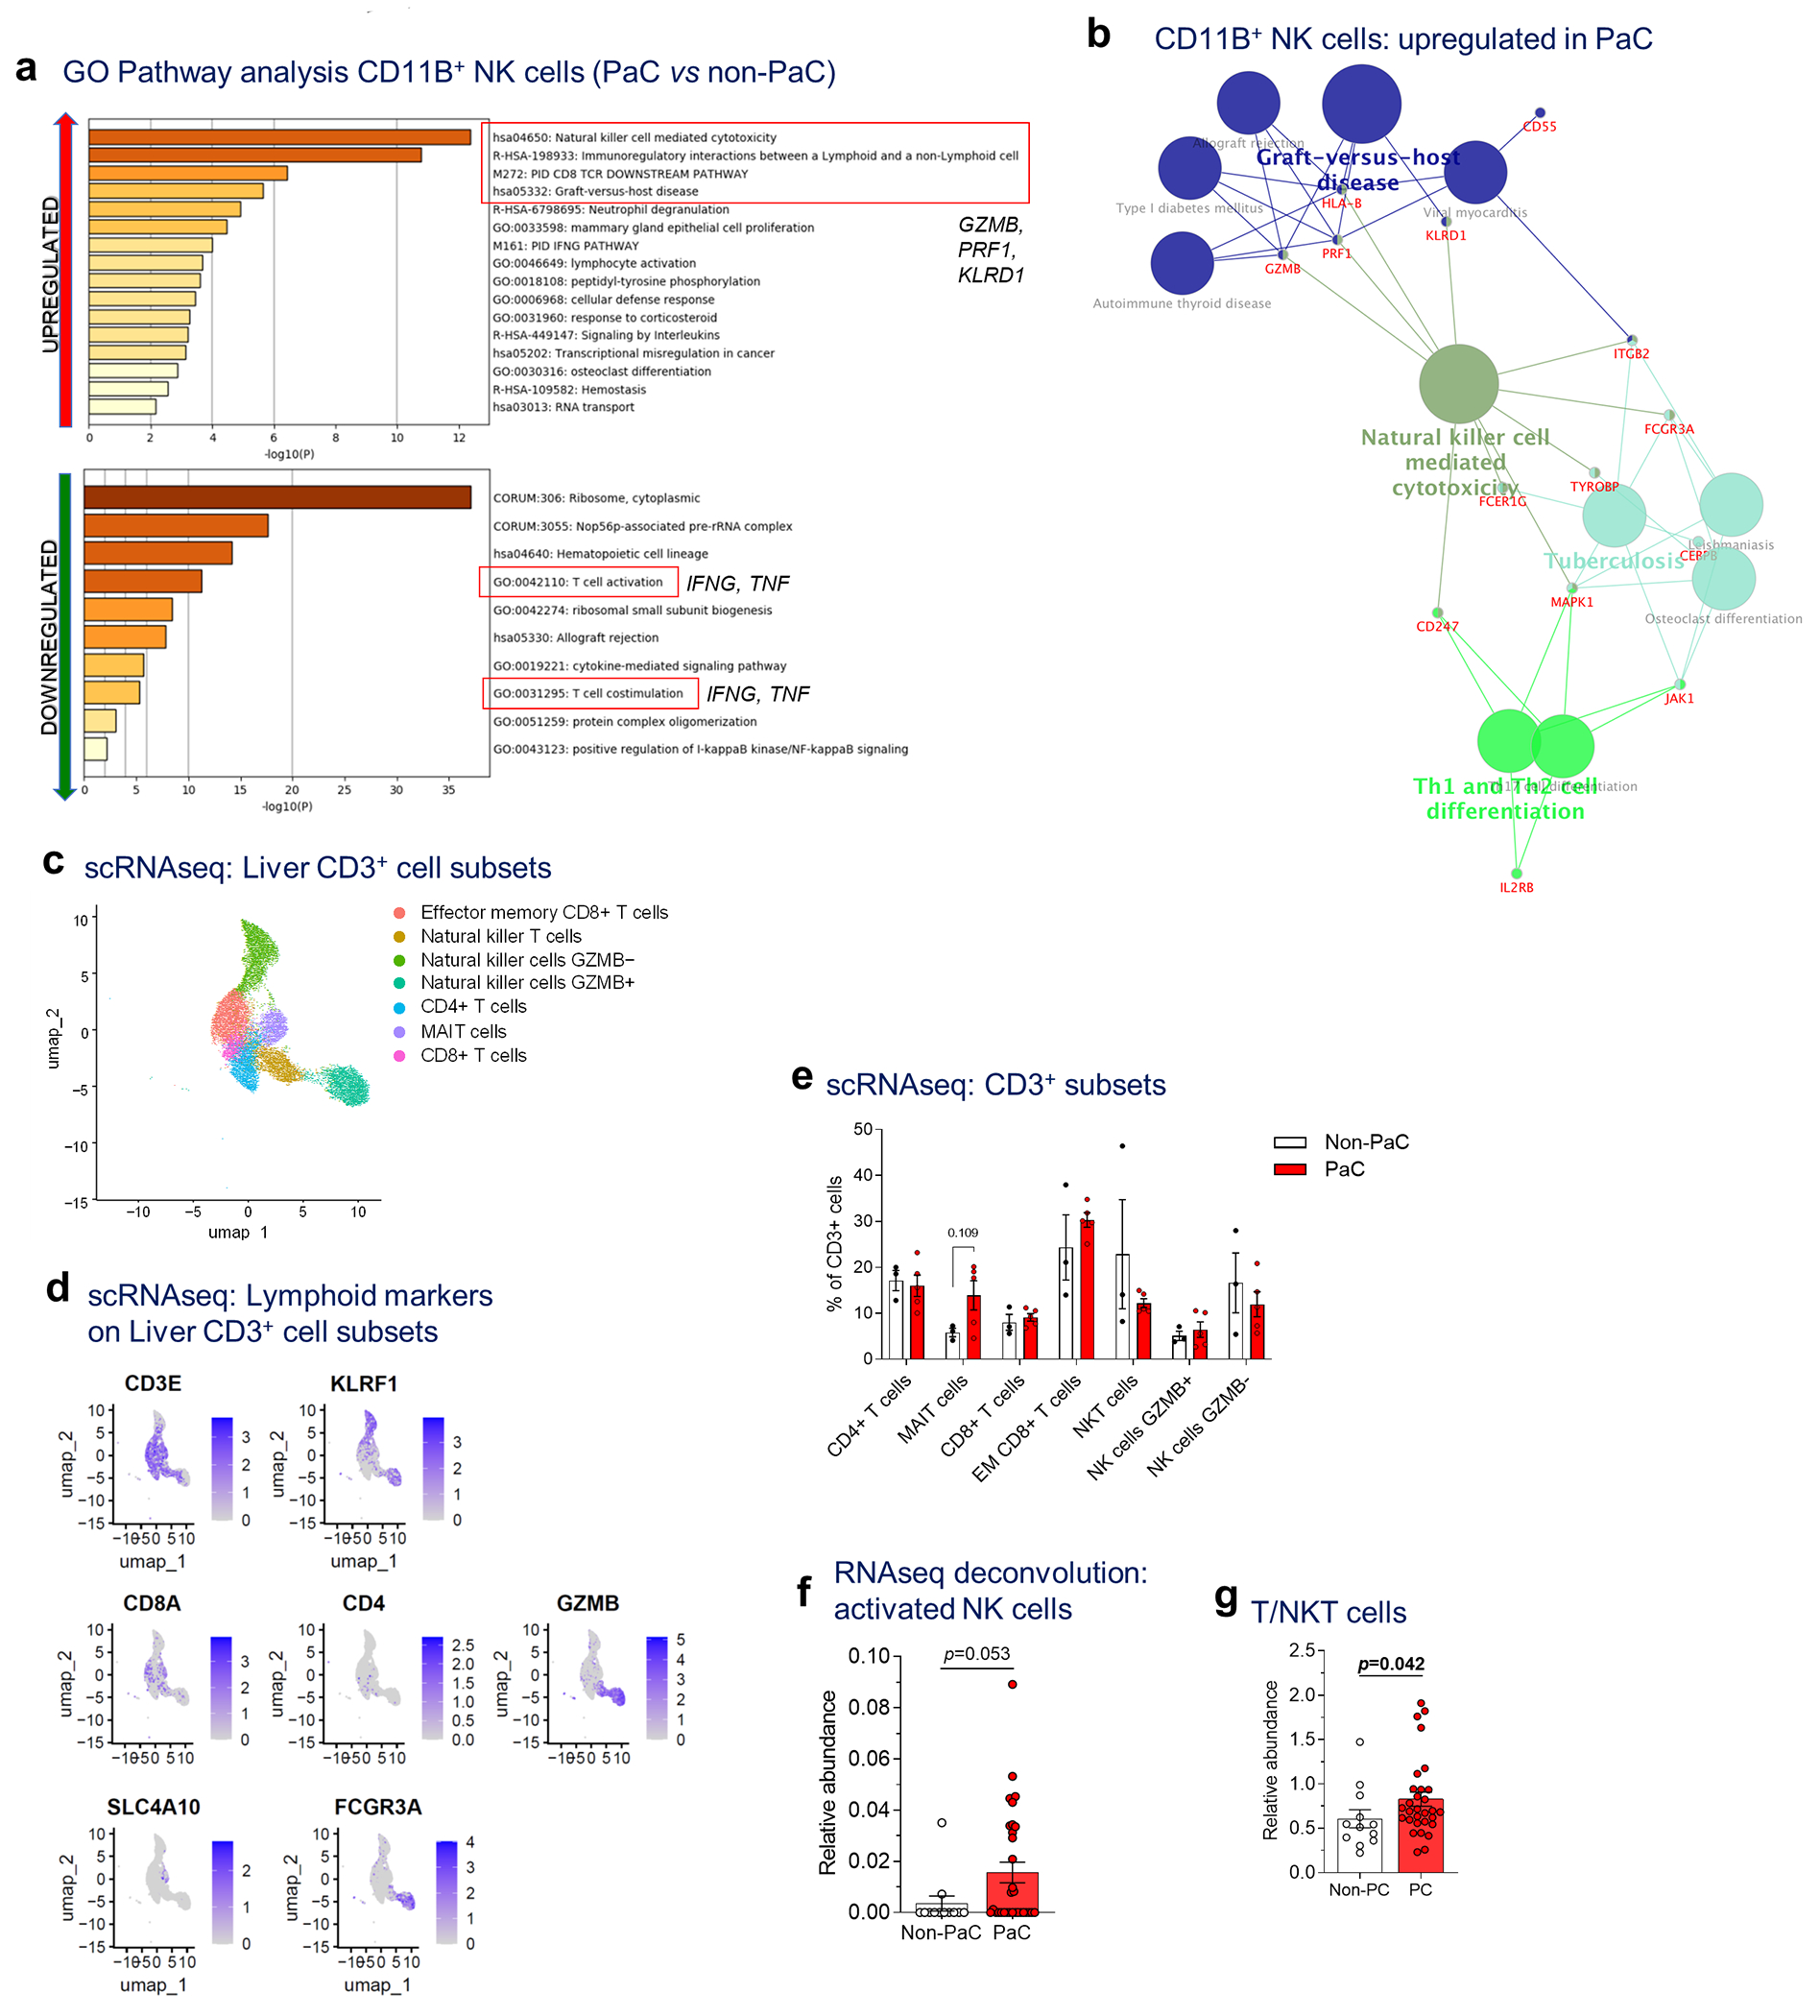
Extended Data Fig. 5 |. scRNAseq of liver immune cells showing altered NK cell subsets.

a, GO pathway analysis (Metascape) of the upregulated genes (upper panel) and downregulated genes (lower panel; cutoff p<0.1, after adjustment for multiple comparisons), b, Immune cell gene clustering (Cytoscape, ClueGO) of genes upregulated in CD11B+ NK cells in PaC vs non-PaC (cutoff p<0.1, after adjustment for multiple comparisons), c-e, Sub-analysis of the lymphoid cluster (corresponding to cluster 5 of Ext. Data Fig. 5a) to explore subsets of CD3-expressing lymphocytes demonstrated 7 sub-clusters (MAIT, mucosa-associated invariant T cells), c. Key defining genes are shown in d and in Figure 3i. e, The relative proportion of these subclusters was compared between PaC and Non-PaC (multiple t-tests with correction for multiple comparisons, shown if p<0.25). f, Cibersort-based deconvolution of the bulk liver mRNA sequencing data using the LM22 immune cell reference gene set for activated NK cells (PaC, n=31; Non-PaC, n=12; Mann-Whitney U-test, p=0.053, Cibersort). g Cibersort-based deconvolution of the bulk liver mRNA sequencing data using the T/NKT immune cell gene set derived in Extended Data Fig. 4 (PaC, n=30; Non-PaC, n=12; Mann-Whitney U-test, p=0.042). MeaniSEM are shown in bar graphs.
