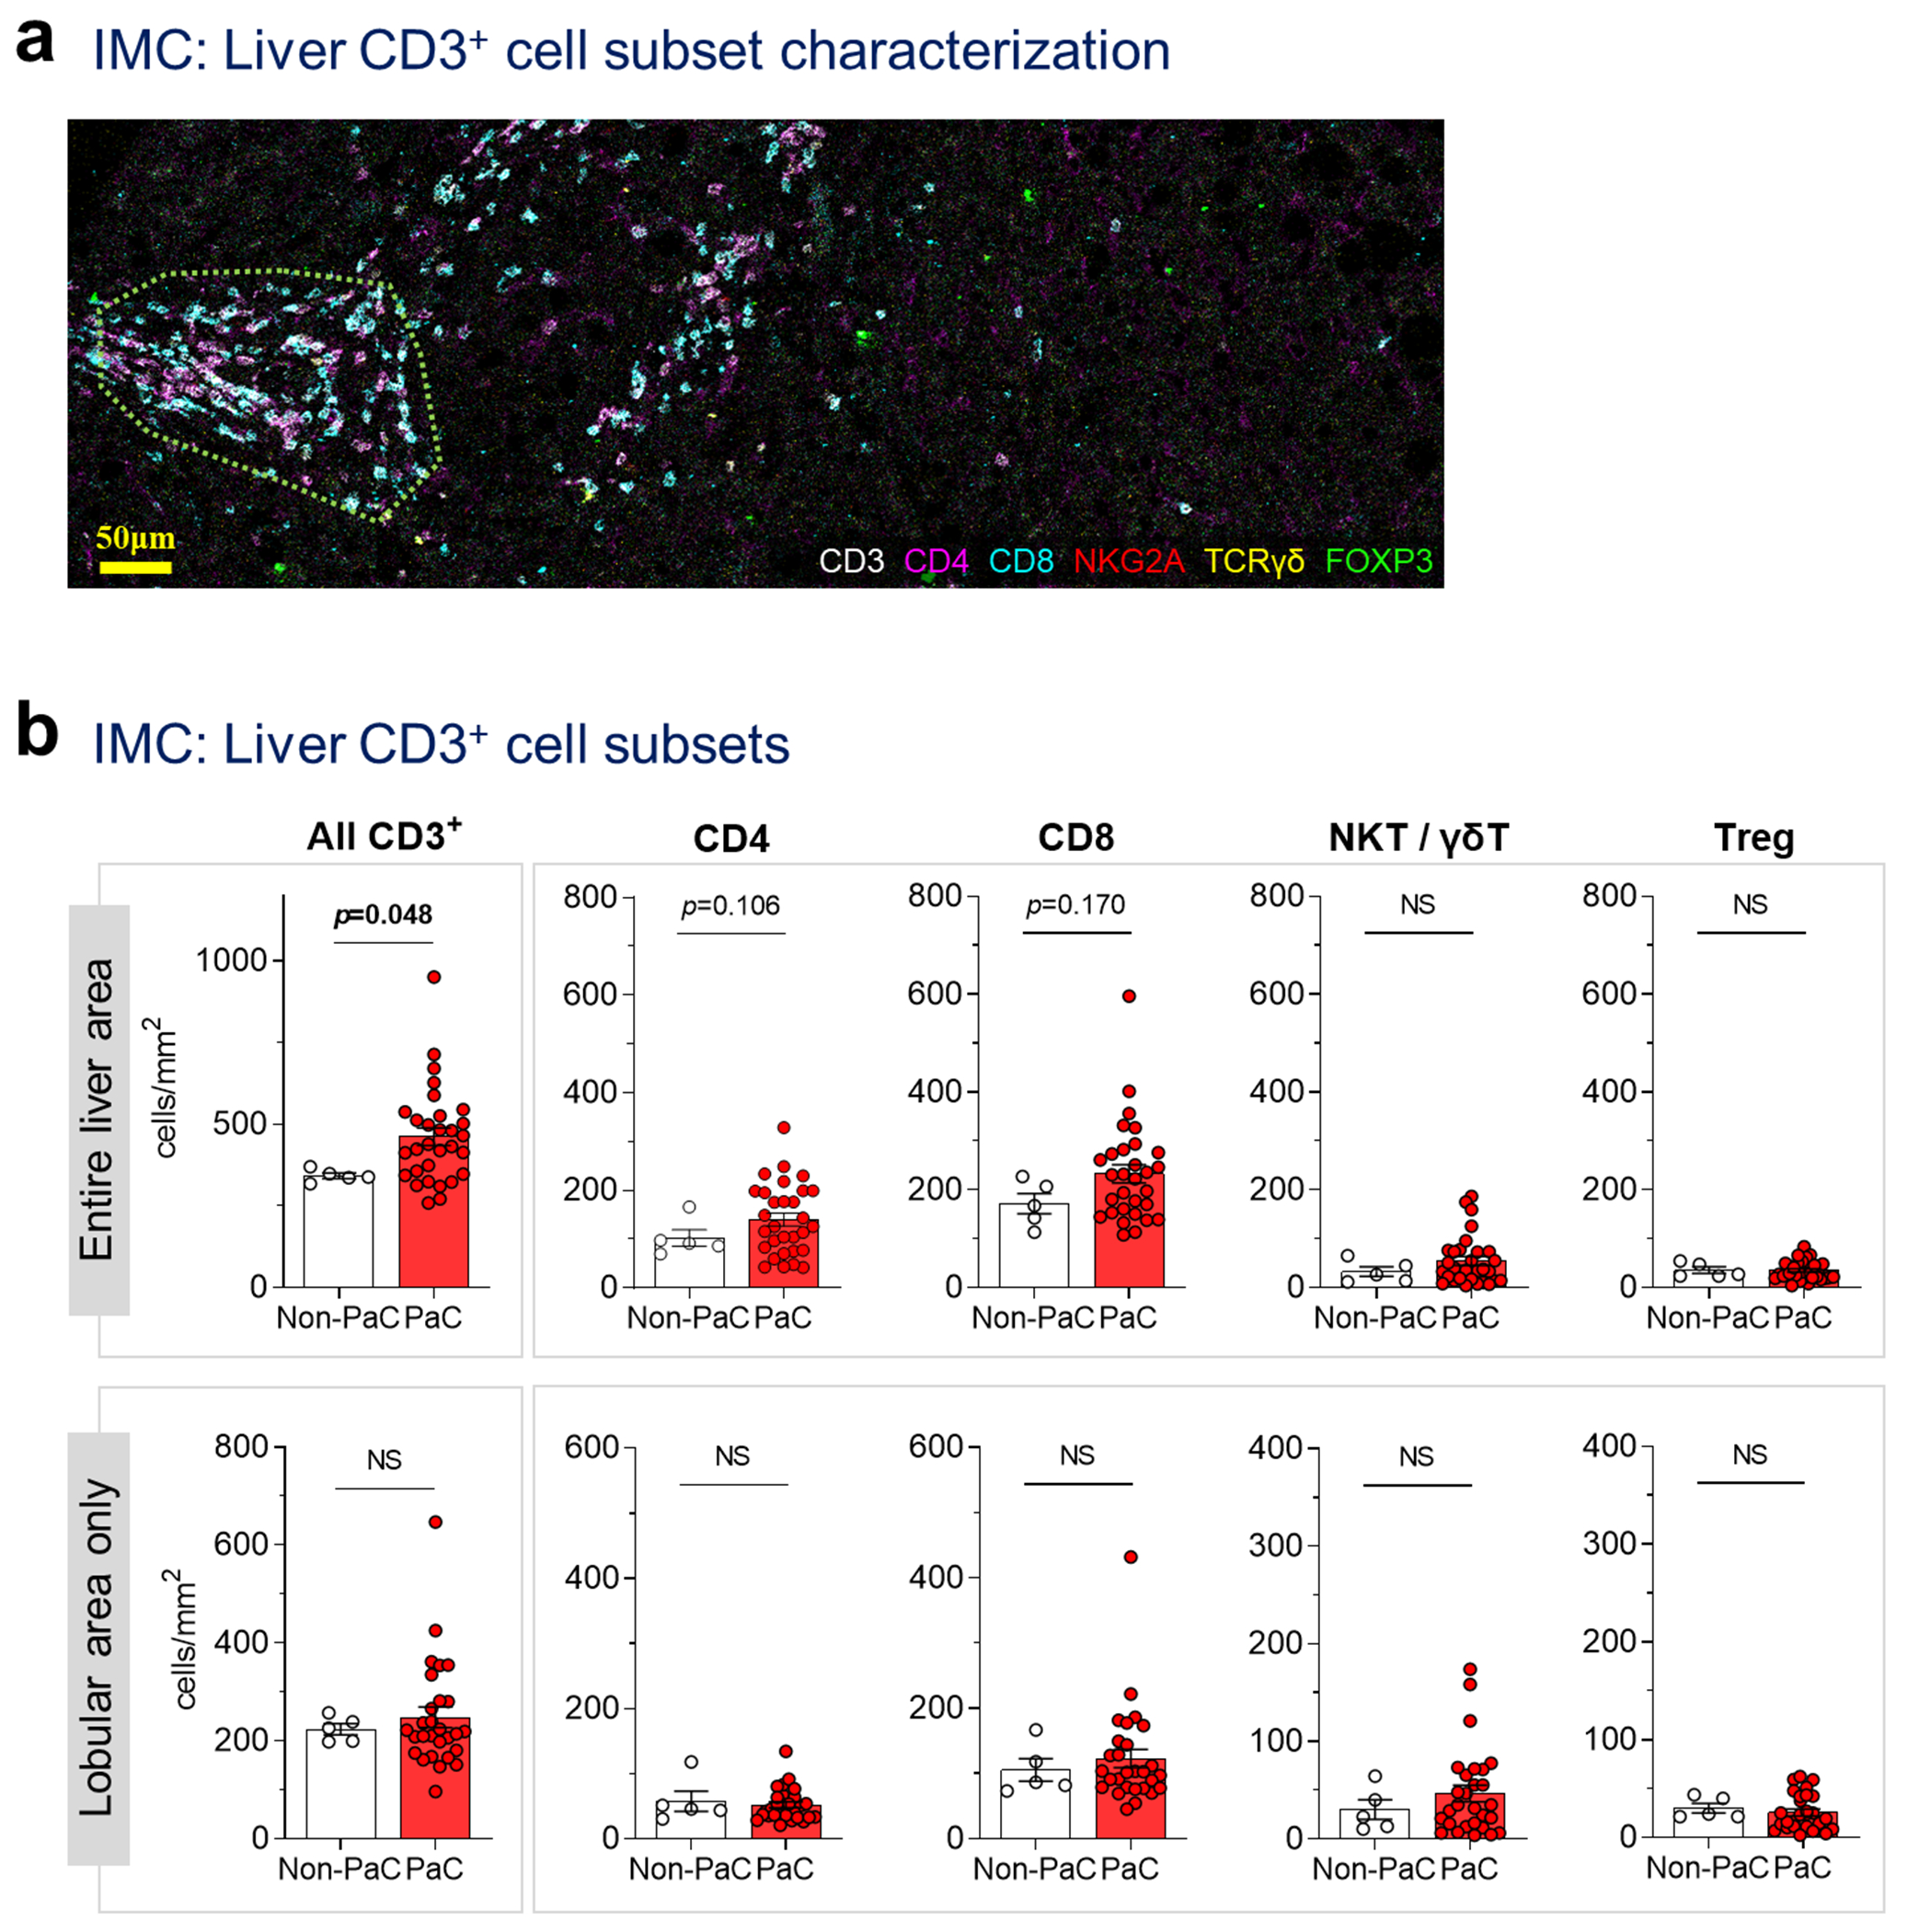
Extended Data Fig. 6 |. Imaging mass cytometry for characterization of CD3+ cell subsets.

Imaging mass cytometry (IMC) was performed on a tissue microarray including 2-3 cores per patient from 5 Non-PaC and 30 PaC patients, a, Representative image from a patient with LiM>6mo demonstrating the staining pattern and the spatial distribution. For calculation of lobular cell densities, portal areas (enclosed in dotted line here) were segmented and subtracted from the total cell count for each patient, b, Subsets of CD3+ cells in the entire liver section, or in the lobular areas only, were compared between PaC and non-PaC: CD3+, p=0.048 (total) and p=0.981 (lobular; Mann-Whitney U-test); CD4+, p=0.048 (total) and p=0.742 (lobular; t-test); CD8+, p=0.170 (total) and p=0.715 (lobular; Mann-Whitney U-test); NKT/yST (TCRy8+ and/or NKG2A+), p=0.477 (total) and p=0.604 (lobular; Mann-Whitney U-test); Treg (FOXP3+), p=0.727 (total) and p=0.448 (lobular; Mann-Whitney U-test). MeaniSEM are shown in bar graphs. Only p<0.25 are shown on the graphs.
