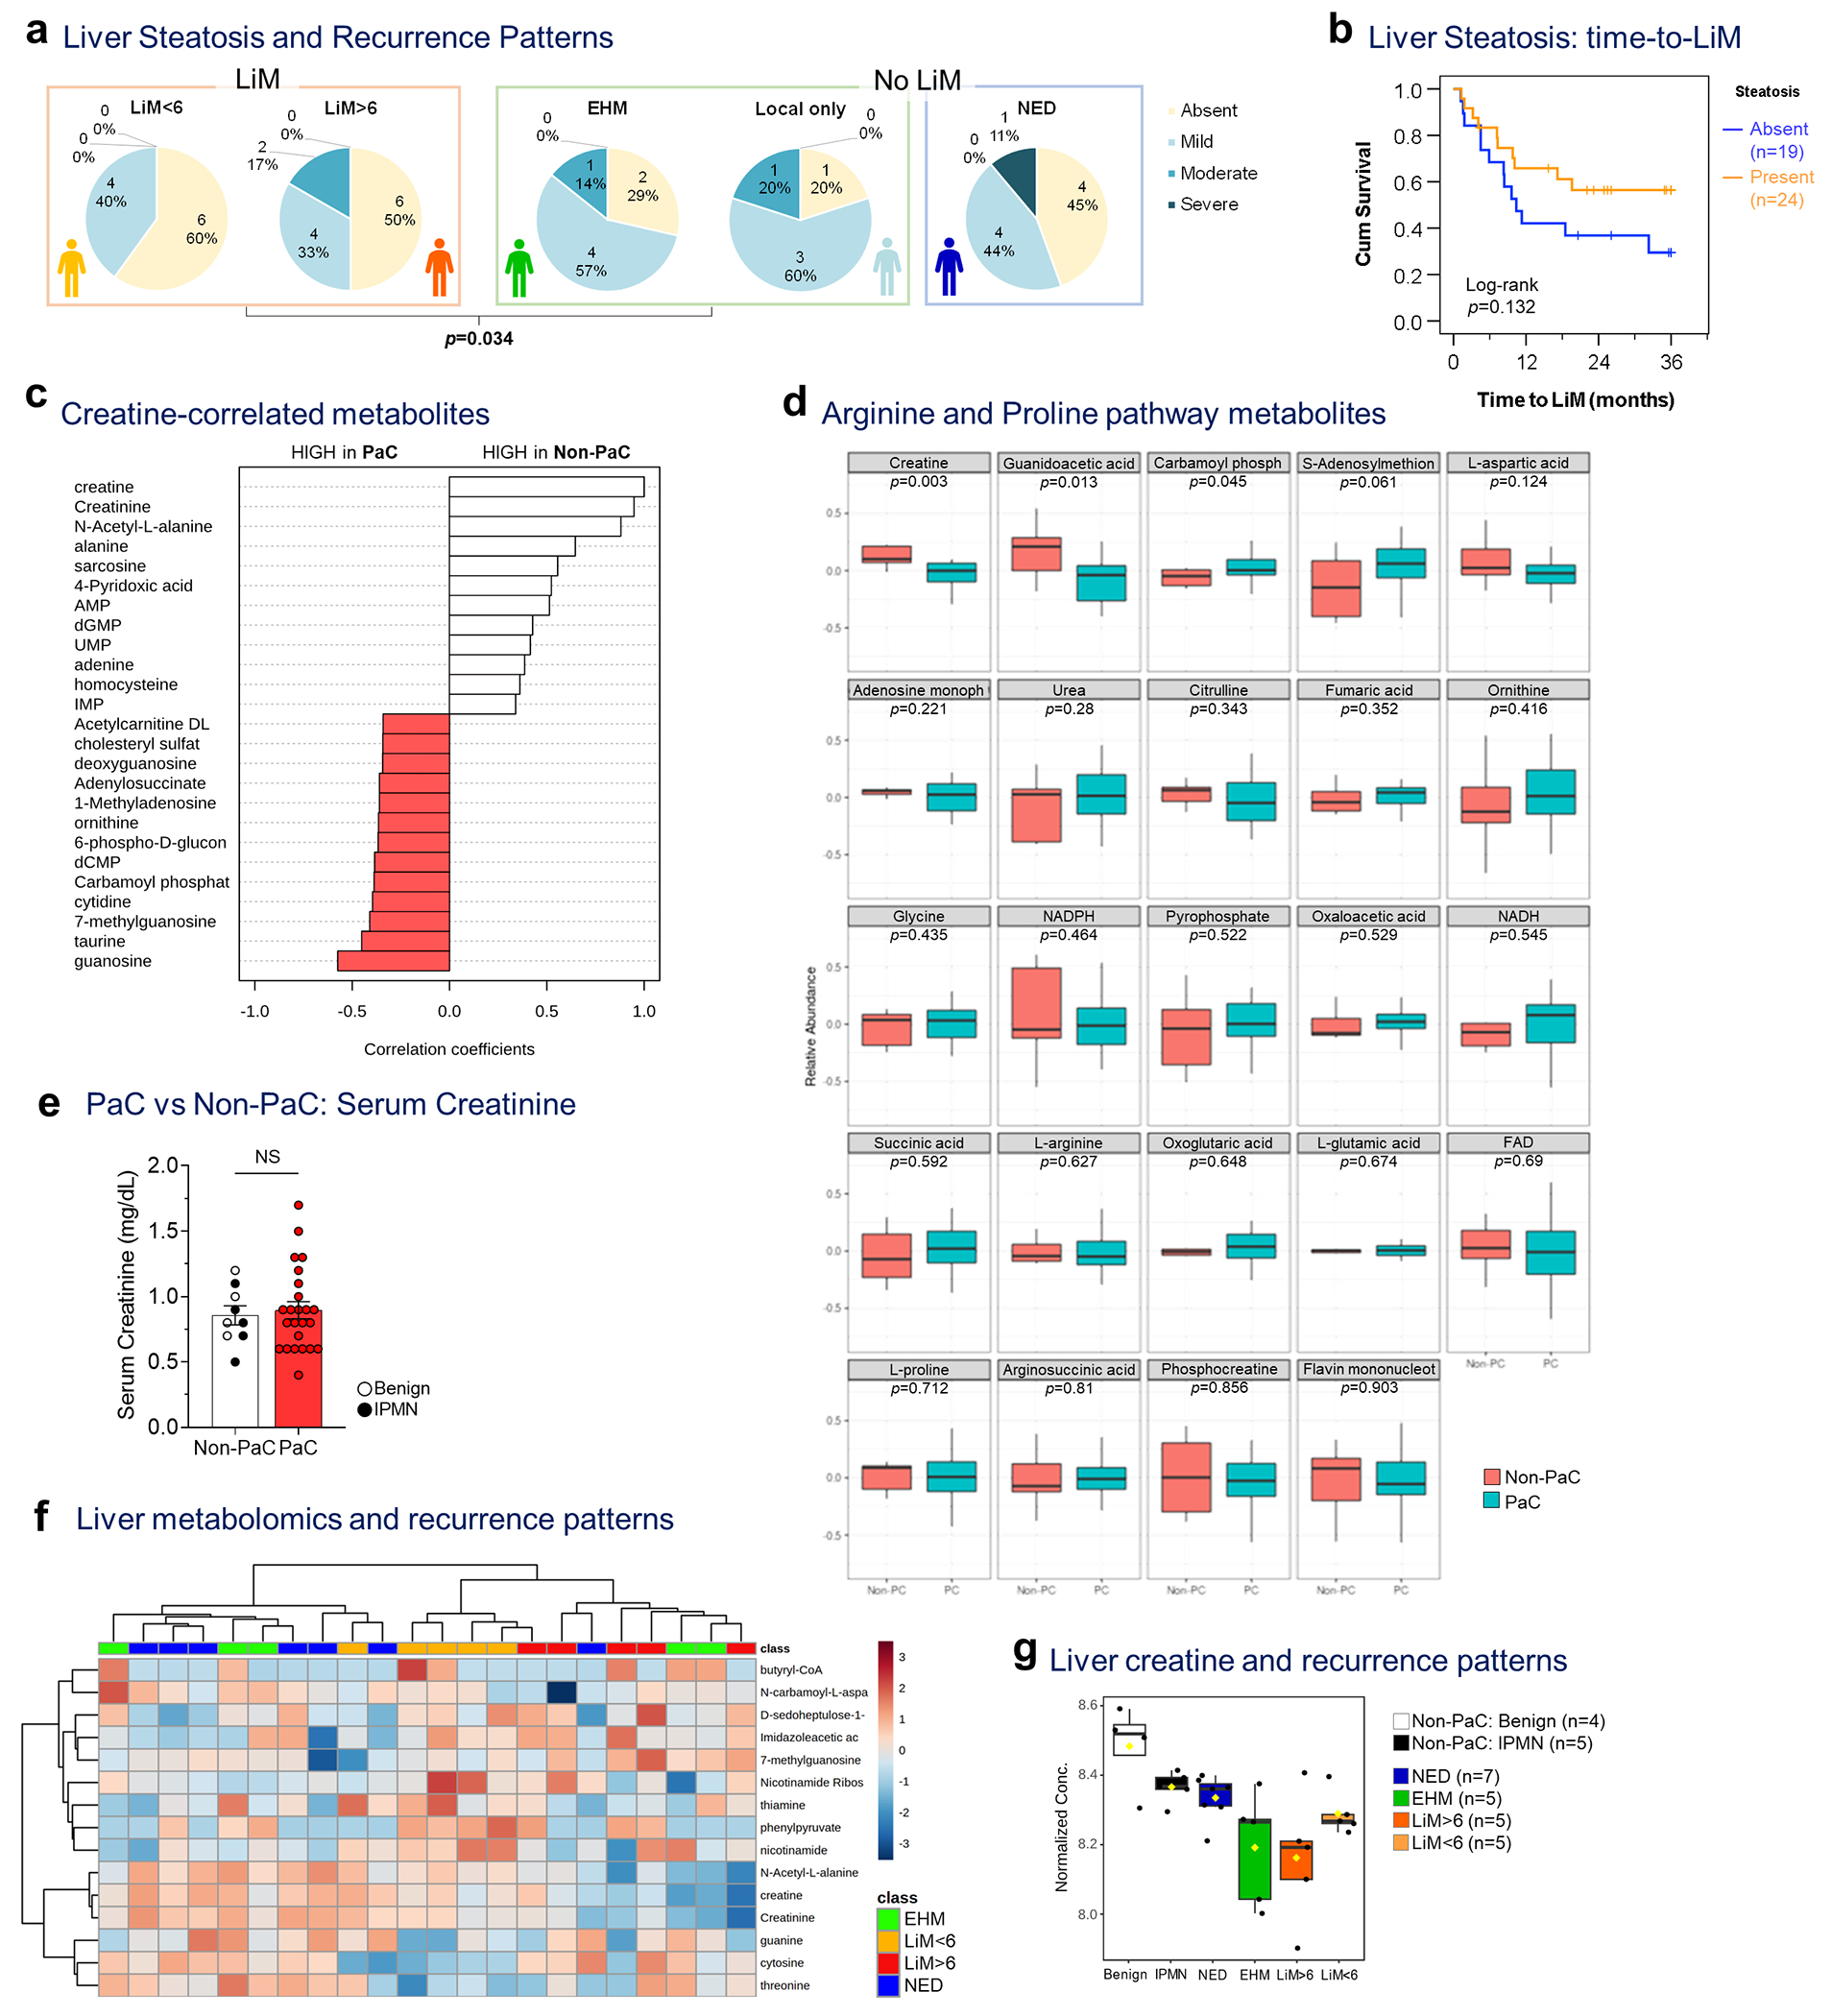
Extended Data Fig. 8 |. Metabolic dysregulations in the pre-metastatic liver.

a, Liver steatosis, graded at the time of resection, was examined separately among patients with LiM (LiM<6 and LiM>6), and patients without LiM (either distant EHM or isolated local recurrence) or disease-free during follow-up (NED). Patients who developed LiM had significantly less steatosis compared to those who developed recurrence at other sites (either distant EHM or isolated local recurrence) which correlated with the severity of metastatic pattern (LiM<6 being the worst and isolated local recurrence being the best prognostic group, based on overall survival outcomes [not shown]; Somer’s d test; p=0.034). b, Kaplan-Meier curve of time to LiM in patients with (n=24) or without (n=19) evidence of liver steatosis (Log-rank test). c, Top 25 metabolites correlated with creatine in the pre-metastatic liver and d, expression of metabolites in the arginine/proline pathway (PaC, n=24; Non-PaC, n=9; t- test with correction for multiple comparisons), e, Comparison of serum creatinine levels among patients who underwent liver metabolomic analysis showed no difference (PaC, n=24; Non-PaC, n=9; Mean±SEM; t-test, p=0.680). f, Top 15 metabolites separating the defined recurrence groups (EHM, n=5; LiM<6, n=5; LiM>6, n=5; NED, n=7), including creatine and g, comparison of creatine levels in all analyzed samples (ANOVA; p<0.001, FDR=0.229). Box plots represent Median±IQR, with whiskers at at 95th percentiles.
