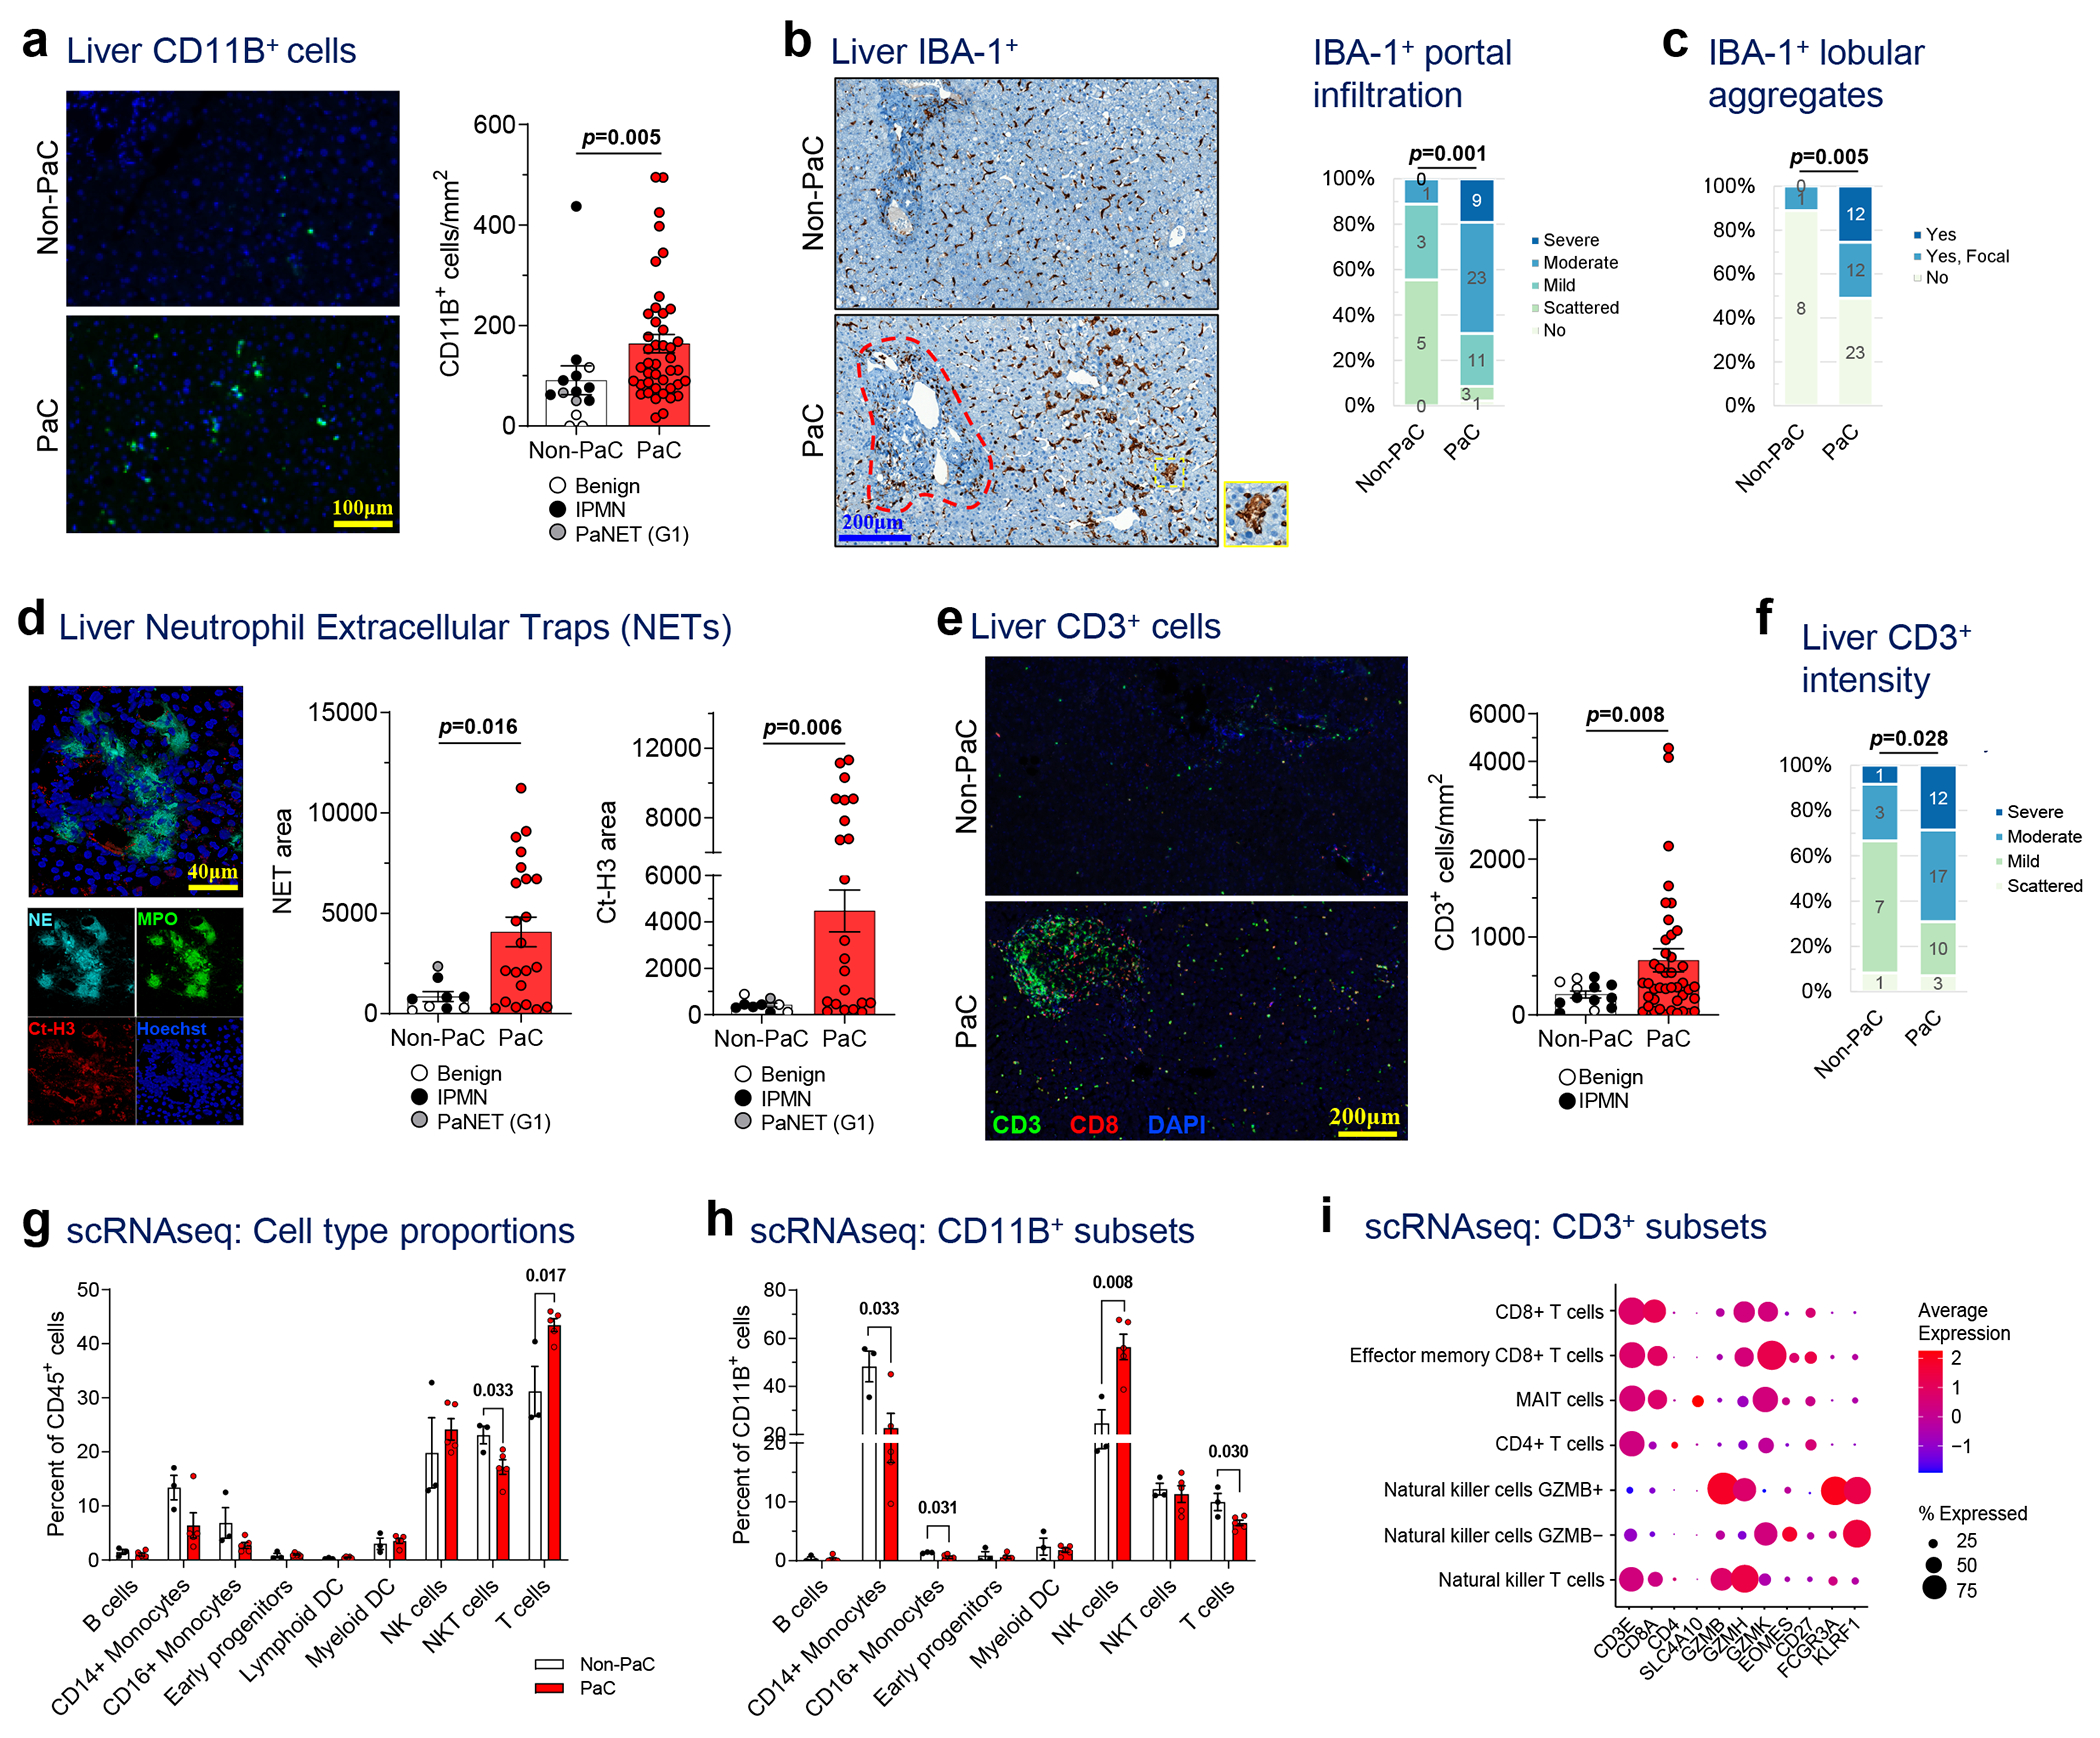
Figure 3 |. Pre-metastatic livers of PaC patients feature changes in infiltrating immune cells.

a, Liver biopsies were stained by immunofluorescence (IF) for the myeloid marker CD11B, quantified with ImageJ, and compared between PaC (n=44) and Non-PaC (n=14; Mann-Whitney U-test; p=0.005). b-c, Liver biopsies were stained by immunohistochemistry (IHC) for the macrophage activation marker IBA-1 and compared between PaC (n=47) and Non-PaC (n=9) after manual quantification by a blinded pathologist of b, the extent of IBA-1+ cell infiltration in the portal tracts (red outline; Somers’ d; p=0.001), and c, the presence of IBA-1+ cell aggregates (yellow outline) in the lobular portions of the liver parenchyma (Somers’ d; p=0.005). d, Liver biopsies were stained for neutrophil elastase (NE) and citrullinated H3 (Ct-H3) to identify clusters consistent with neutrophil extracellular traps (NETs). Stained area was quantified with ImageJ and compared between PaC (n=22) and non-PaC (n=9; Mann-Whitney U-test: NE area, p=0.016); CtH3 area, p=0.006). e-f, Liver biopsies were co-stained by IF for CD3 and CD8. e, CD3+ T cells were quantified using ImageJ and compared between PaC (n=42) and Non-PaC (n=13; t-test; p=0.008). f, A blinded pathologist quantified the intensity of CD3+ lymphocyte staining, (Somers’ d; p=0.028). g-i, Single-cell RNAseq was performed on hepatic NPCs (>90% CD45+) from 3 non-PaC and 5 PaC patients and analyzed as shown in Ext. Data Fig. 4–5. g, Comparison of the relative abundance of the major cell clusters between PaC and Non-PaC (multiple t-tests with correction for multiple comparisons, shown if p<0.25). g, The percentage of different cell clusters among CD11B+ cells was calculated and compared between PaC and non-PaC (multiple t-tests with correction for multiple comparisons, shown if p<0.25). h, Subset analysis of CD3+ cells (Ext. Data Figure 4) resulted in four T cell subclusters as well as NKT cells and two NK cell cluster (MAIT, mucosa-associated invariant T cells). i, Subset analysis of CD3+ cells resulted in four T cell subclusters as well as NKT cells and two NK cell clusters (MAIT, mucosa-associated invariant T cells). Mean±SEM are shown in bar graphs.
