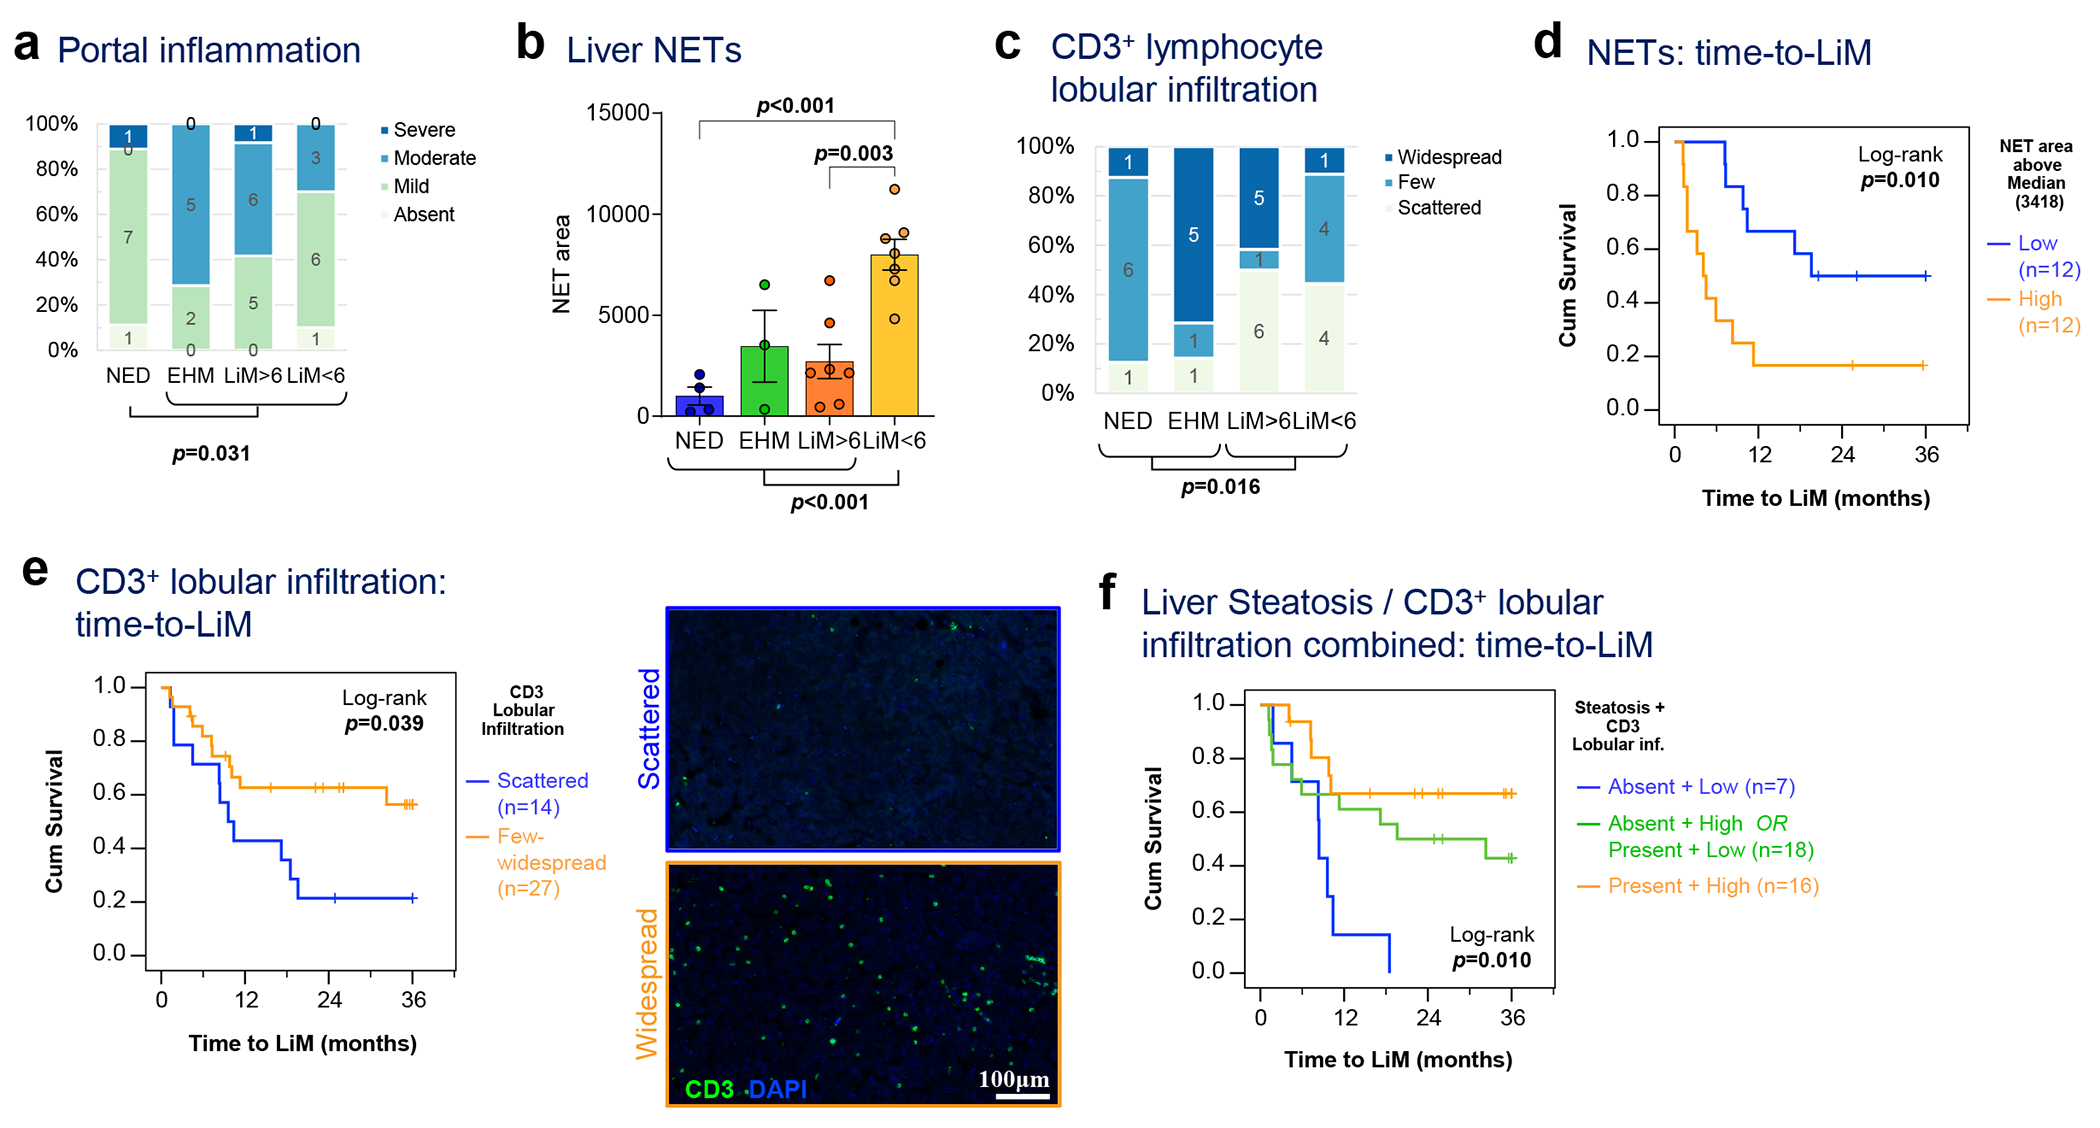
Figure 4 |. Alterations in pre-metastatic liver-infiltrating immune cells correlate with patterns and timing of metastasis.

a, Liver biopsies obtained at the time of resection from patients with NED, or distant recurrence (EHM, LiM>6, or LiM<6) were manually scored by a blinded pathologist for portal inflammation (Kruskal-Wallis test). b, NET area quantified as in Fig. 3d was compared among the different recurrence groups (n=21; Mean±SEM; ANOVA p=0.001; multiple t-tests with correction for multiple comparisons shown if p<0.25). c, Liver CD3+ lymphocyte lobular infiltration was manually scored by a blinded pathologist and compared among the different recurrence groups as well as between LiM and no LiM (Kruskal-Wallis test; p=0.016). d, Kaplan-Meier curve of time to LiM for high versus low NET area, as quantified in (b) (n=24; log-rank test; p=0.010). e, Kaplan-Meier curve of time to LiM for scattered versus few/widespread lobular CD3+ lymphocyte lobular infiltration, as scored in (c), with representative examples shown in side panels (log-rank test; p=0.039). f, Steatosis (absence vs presence) and CD3+ lymphocyte lobular infiltration (as in c) were used to classify PaC patients in 3 subgroups, and time to LiM was compared among them (n=42; log-rank test; p=0.010).
