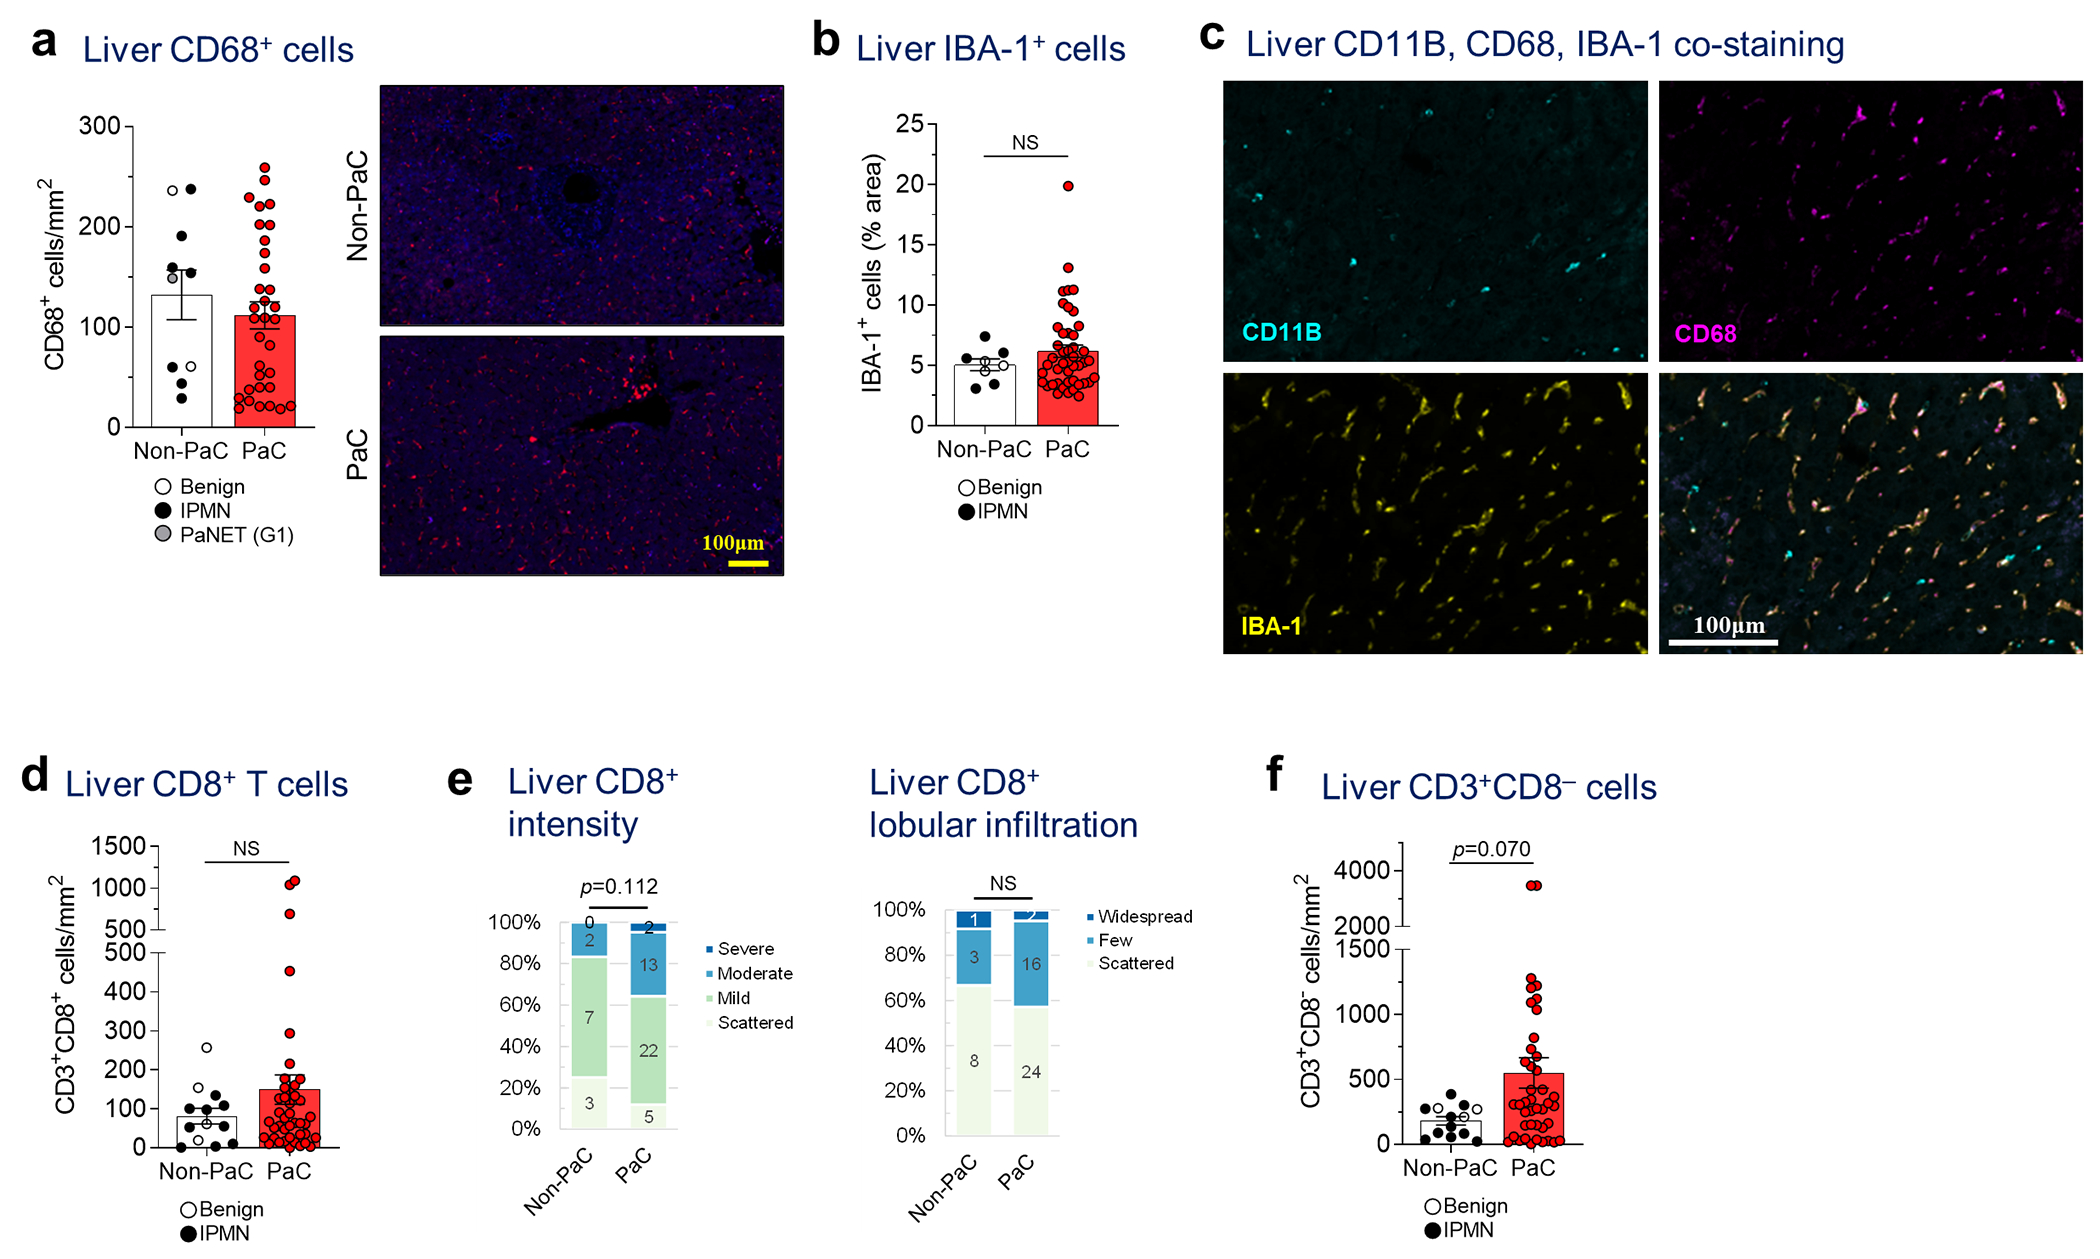
Extended Data Fig. 3 |. Liver immune cell characterization.

a, Liver biopsies stained by immunofluorescence (IF) for CD68, quantified using ImageJ and compared between PaC (n=33) and Non-PaC (n=10; Mann-Whitney U-test; p=0.356). b, Liver biopsies were stained by immunohistochemistry (IHC) for the macrophage activation marker IBA-1. The percentage of stained area was quantified with ImageJ and compared between PaC (n=45) and Non-PaC (n=8; Mann-Whitney U-test; p=0.687). c Liver biopsies were co-stained by IF for CD11B, CD68, and IBA-1 to assess for overlap of these markers (n=3). d-f, Liver biopsies were co-stained by IF for CD3 and CD8 as in Fig. 2e–f. d, CD3+CD8+ T cells were quantified using ImageJ and compared between PaC (n=42) and Non-PaC (n=13; Mann-Whitney U-test; p=0.565). e, The intensity of CD8 staining and the degree of CD8+ T cell lobular infiltration in PaC livers (n=42) were assessed by a blinded pathologist and compared to non-PaC livers (n=12; Somers’ d; p=0.112 and p=0.648, respectively), f, CD3+CD8” lymphocytes were quantified using ImageJ and compared between PaC (n=42) and Non-PaC (n=13; Mann-Whitney U- test; p=0.070). MeaniSEM are shown in bar graphs.
