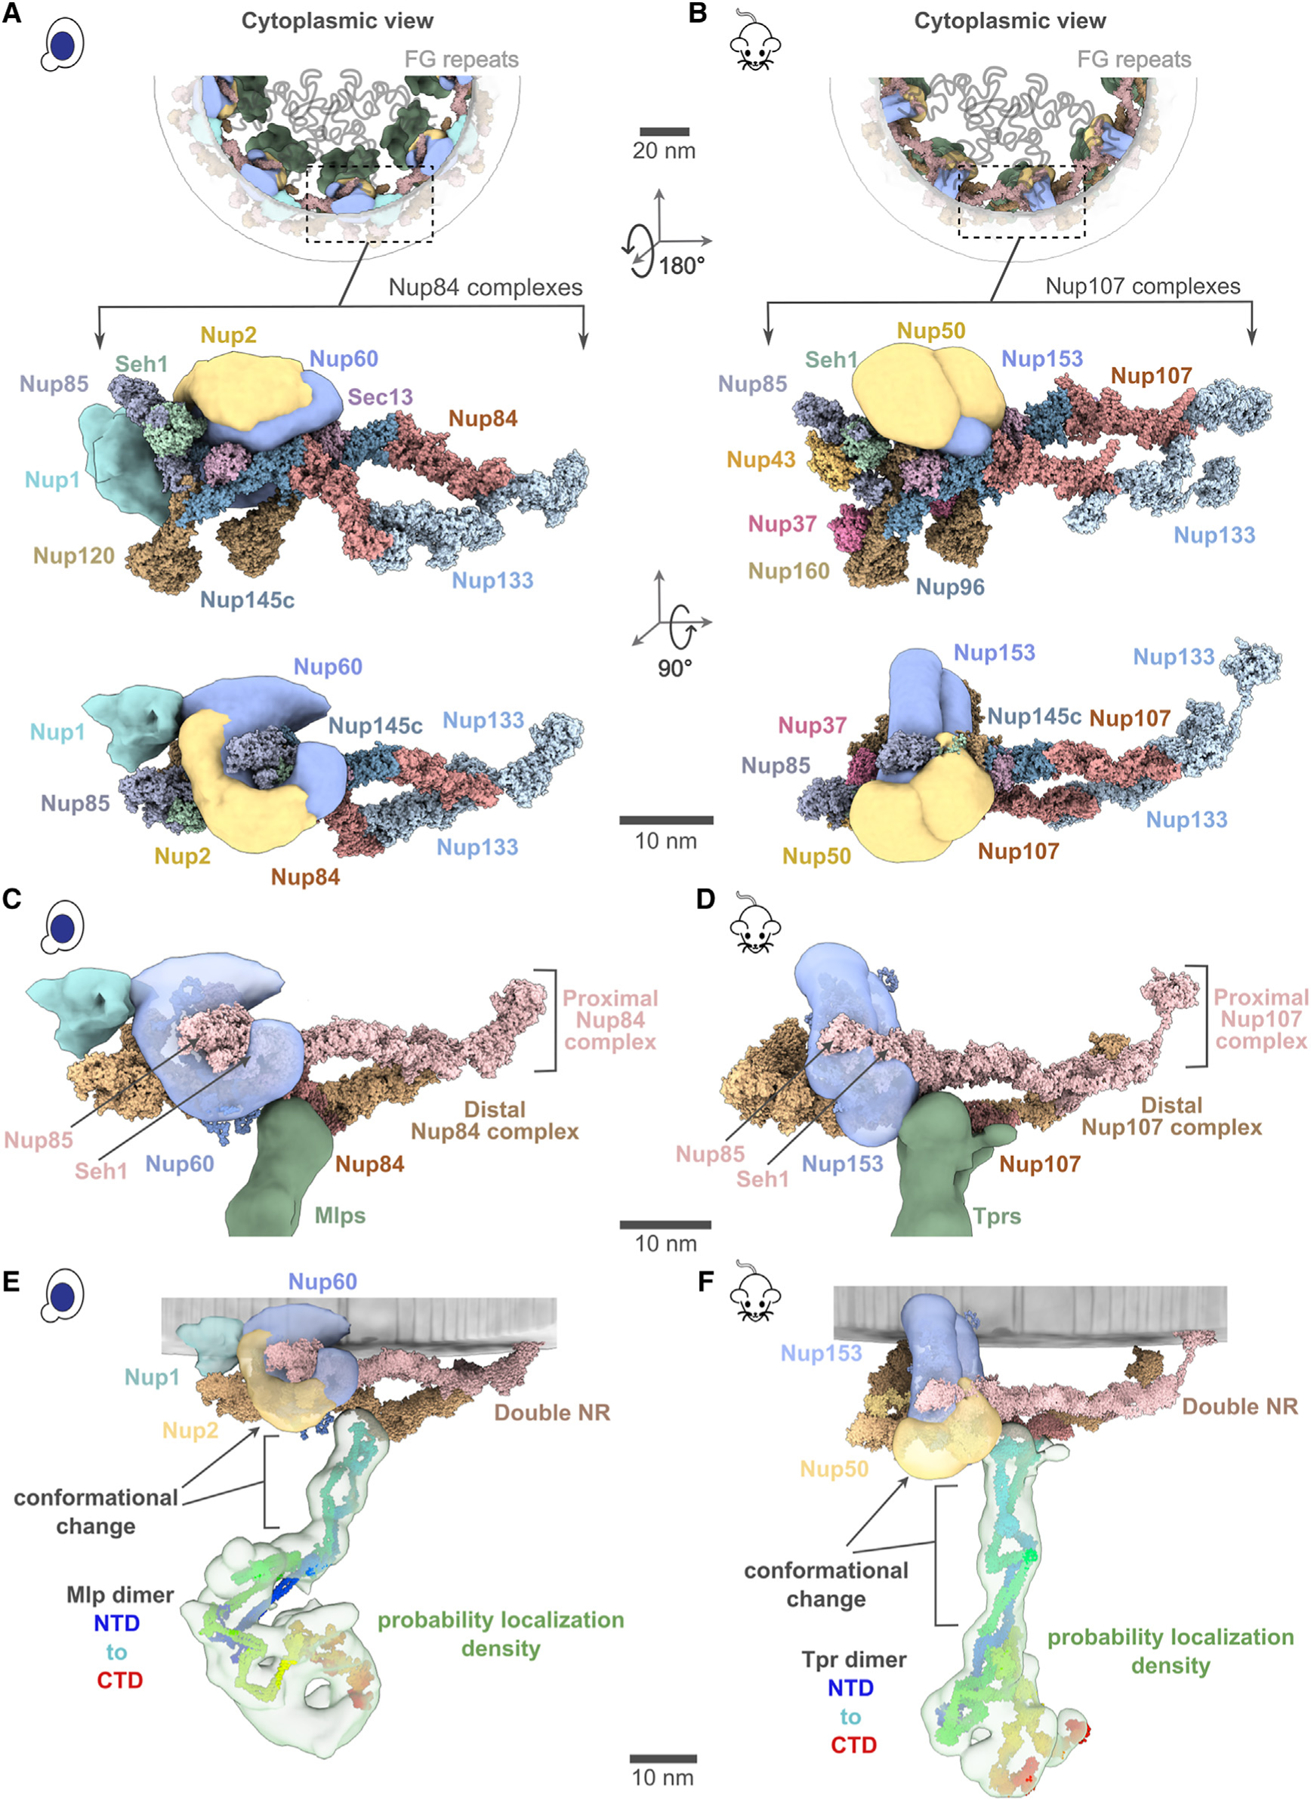
Figure 5. Position of different nucleoporins in the basket model.

(A and B) Cytoplasmic view of the yeast and mammalian basket zooms into a Y-complexes (yNup84 complex for yeast and mNup107 complex for mammalian). Schematic representations of the FG repeats and anchoring positions are shown as curly lines (gray). Each double Y-complex’s zoomed image highlights individual Nups with two different views. Localization densities of the basket anchors, yNup1 (cyan), yNup2/mNup50 (dark yellow), and yNup60/mNup153 (violet), are shown relative to the Y-complex Nups.
(C and D) Close-up inner view of the localization densities of the yNup60/mNup153 (violet) that contacts with the proximal nuclear ring (pink), whereas the localization densities of yMlp/mTpr dimer (green) contacts the distal nuclear ring (tan) of the NPC. yNup2/mNup50 not shown in this view.
(E and F) The yMlp/mTpr dimer centroid models were colored from the N terminus (blue) to the C terminus (red) and shown embedded within their localization probability density (light green). The region identified by the unidirectional arrows and the square brackets indicates the local conformational change of yMlp/mTpr and yNup60/mNup153 between yBasket and mBasket models.
Scale bars, 20 and 10 nm. See also Figures S5 and S6.
