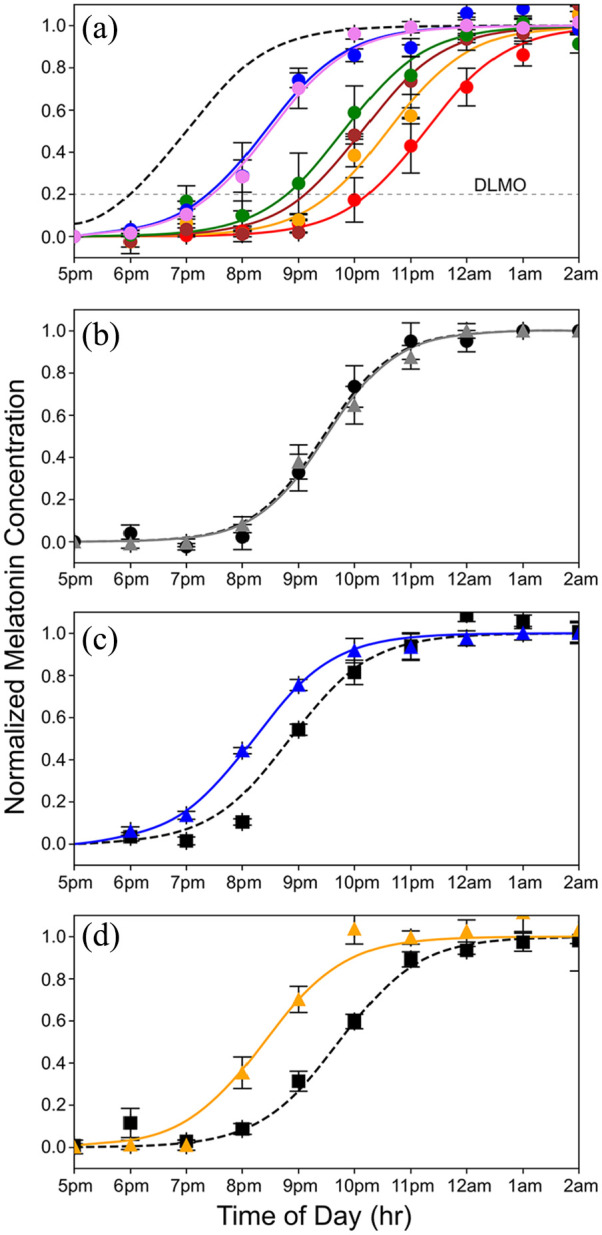
Figure 2.

Curves showing the nighttime dim rise in salivary melatonin levels under various conditions equated for melanopsin effectiveness. (a) Rise in evening melatonin levels for the 6 subjects who participated in this study (each is shown in a different color; error bars are standard errors of the mean). The dashed gray curve shows the predicted rise if the subjects were aligned to earth time, where the beginning of internal biological night occurs at sunset, which is 1800 h based on a 12-12 dark light cycle. On average, subjects were phase delayed 2.8 h. (b) Average rise in evening melatonin after 2-h exposure to the static white light (gray curve) of Figure 1a compared to a baseline (dashed curve) measured on day 1 of the 3-day protocol. A slight, nonsignificant phase delay was associated with the white light exposure (n = 6 subjects). (c) Average rise in evening melatonin (blue curve) after a 2-h exposure to the 476 nm blue light of Figure 1b compared to baseline (dashed curve) (n = 6 subjects). The 476 nm light produced a phase advance of 40 min (t = 3.4, p = 0.019). (d) The rise in evening melatonin (orange curve) after 2-h exposure to 19 Hz S-cone modulated light compared to baseline (dashed curve) (n = 6 subjects). This light produced a phase advance of 1 h and 20 min (t = 7.1, p = 0.0009).
