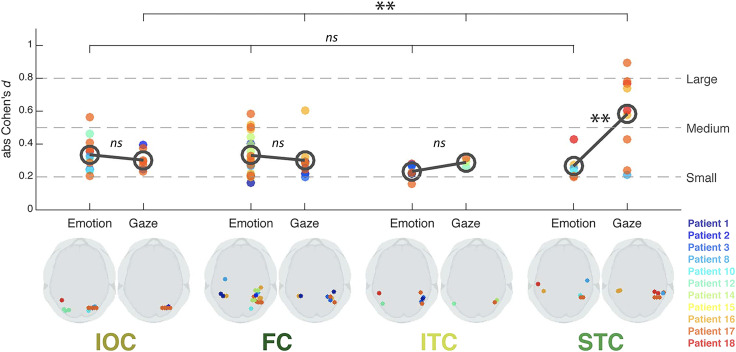
Figure 3. .
Effect sizes for gaze and emotion within four occipitotemporal ROIs. Bottom image: Schematic axial slices for each ROI (IOC, FC, ITC, and STC) showing bipolar site pair locations (indicated by dots) responding significantly to emotion (left side) or gaze (right side). Color legend for individual patients is at the right. Top image: effect size (absolute Cohen's d) plotted as a function of ROI for each patient's bipolar electrode sites. The dark gray open circles denote mean effect size across sites within each ROI, for emotion and gaze, respectively. Statistical comparison of effect sizes between emotion and gaze in each ROI (gray bars between open circles) and across ROIs for emotion and gaze effects (top bars) was performed. Broken lines on the plot represent commonly accepted evaluations of effect size values. FC = fusiform cortex; ITC = inferior temporal cortex; ns = not significant. **p < .01. Reproduced with CC BY 4.0 Deed from Babo-Rebelo and colleagues (2022).

