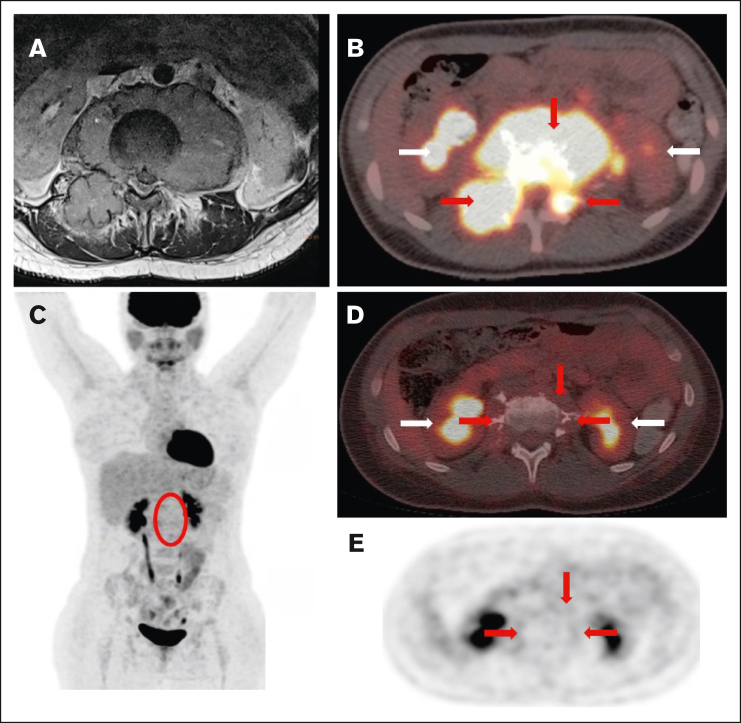
Figure 6.
Staging and response assessment. Imaging at staging shows a large paraspinal mass (A, MRI) with intense glucose metabolism (B, 18F-FDG-PET/CT; red arrows = lymphoma; white arrows = normal kidneys). The mass originates from the bone and extends into the neuroforamen and the spinal canal (A-B). After 2 courses of OEPA chemotherapy, 18F-FDG-PET shows a good metabolic response (C, maximum intensity projection; red circle surrounds the slight residual uptake of the former CNS lesion; [D-E] 18F-FDG-PET/CT; same height as panel B; minimal glucose metabolism within the residual mass [red arrows]).

