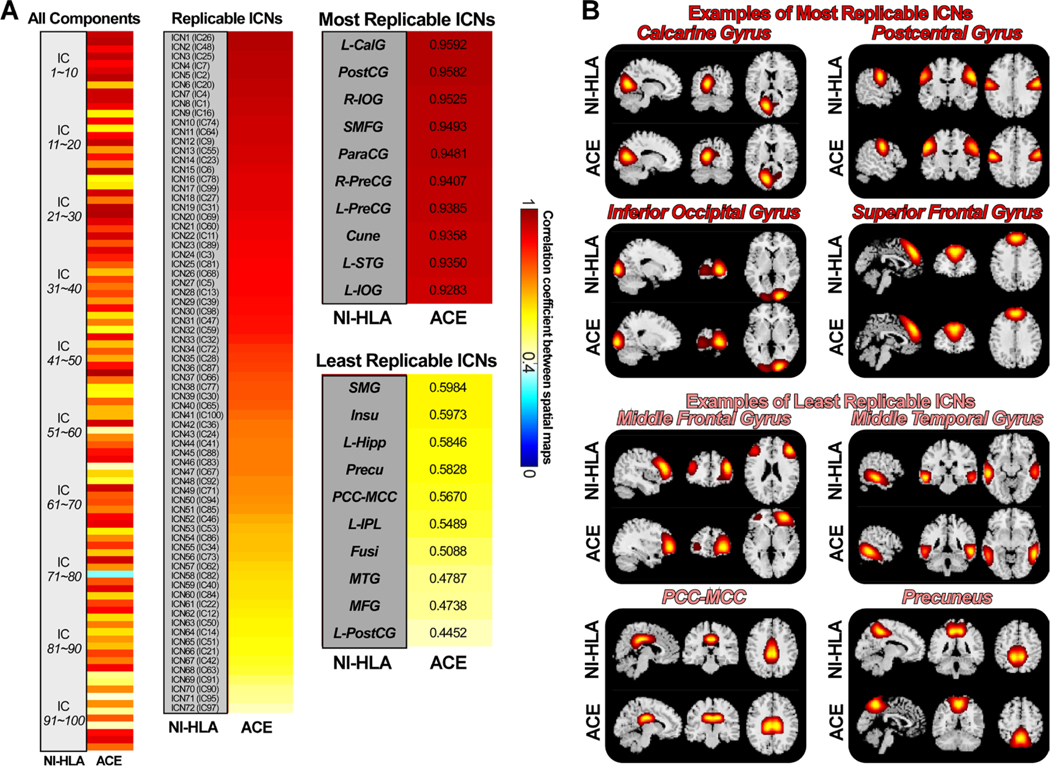
Fig. 4.
Spatial matching results of the ICs from two infant datasets. A) Spatial correlations between matched ICs from the reference data (NI-HLA) and the replication data (ACE). Correlations between meaningful ICNs are also displayed (r > 0.4 for the replication data), sorted by the correlation value. ICNs are used for the construction of the infant template. B) Examples of the most and the least replicable ICNs between the reference and replication data. ICNs show similar activation patterns between datasets.

