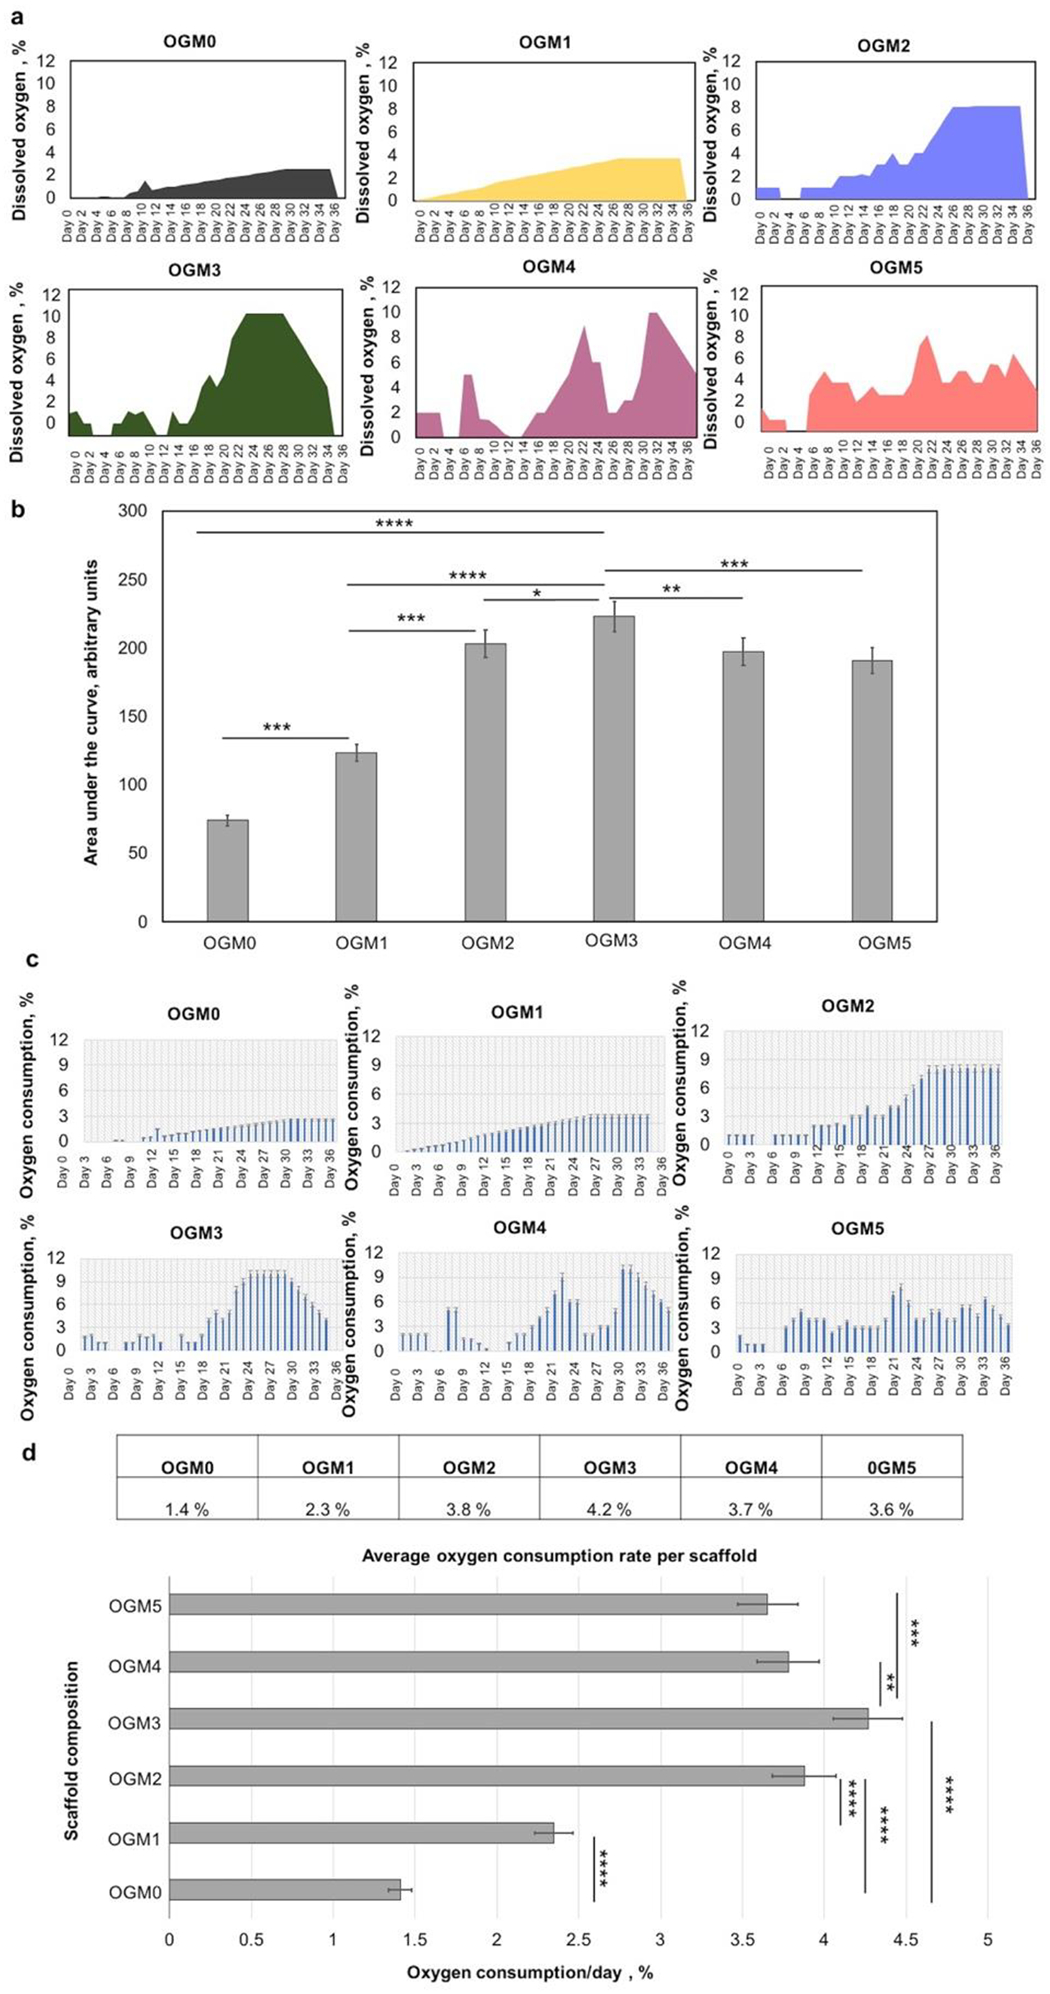
Figure 6.

Evaluation of the net oxygen consumption and the oxygen consumption rates of the encapsulated H9c2 cardiomyocytes within the oxygen-generating scaffolds. A. The net oxygen consumption within each scaffold composition was monitored and recorded over 35 days, b. The area under the curve for each scaffold was quantified and compared. The OGM3 scaffolds had a significantly higher net oxygen consumption compared to the other scaffold groups. C. The oxygen consumption rate per day was calculated. The OGM3 scaffolds exhibited the fastest oxygen consumption rate over 35 days. The quantification of the oxygen release capacity and net oxygen consumption revealed a positive correlation with cellular response. The OGM3 scaffolds presented optimized cellular response.
