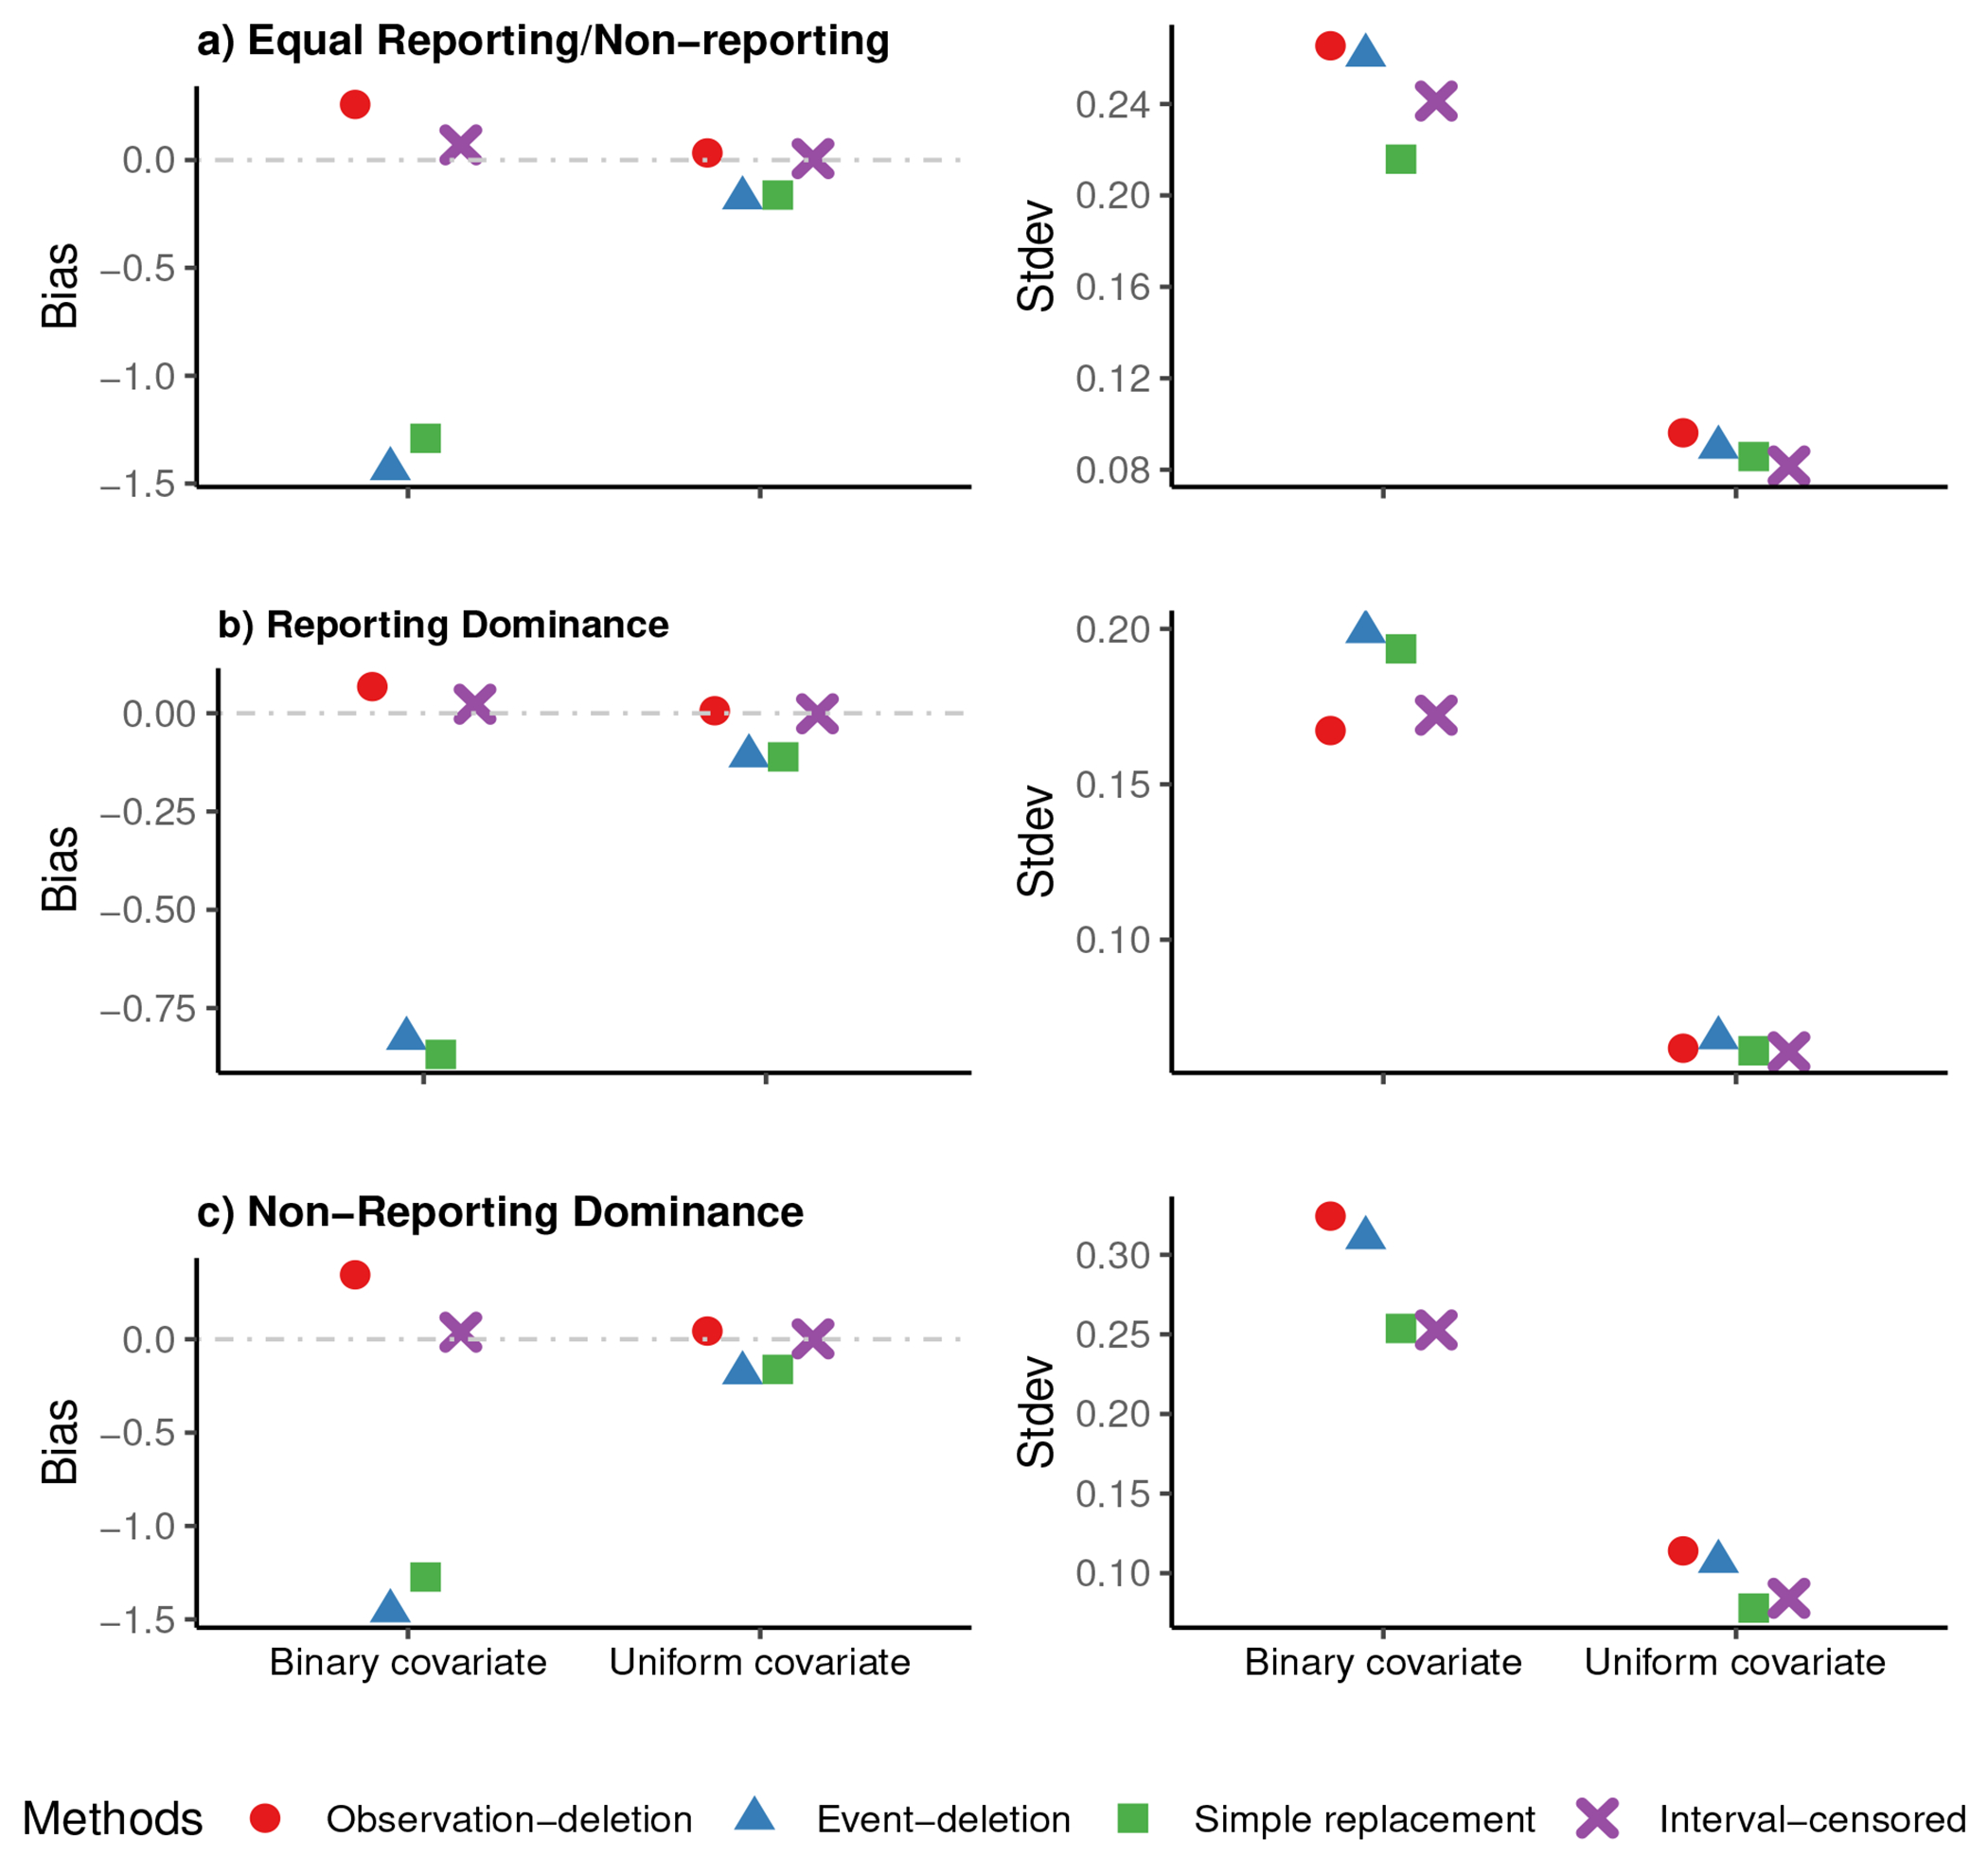
Figure 2:

Plots of observed bias in the left column, and standard deviation (Stdev) in the right column of the estimated risk factor’s coefficient in ‘observation-deletion’, ‘event-deletion’, ‘Simple replacement’, and ‘Interval-censored’ scenarios, for a) ‘Equal Reporting/Non-reporting’ (the top panel), b) ‘Reporting Dominance’ (the middle panel), and c) ‘Non-Reporting Dominance’ (the bottom panel), for n=5000 in 500 simulations when about 30% of individuals have experienced the event by the time of survey.
