
FIGURE 3.
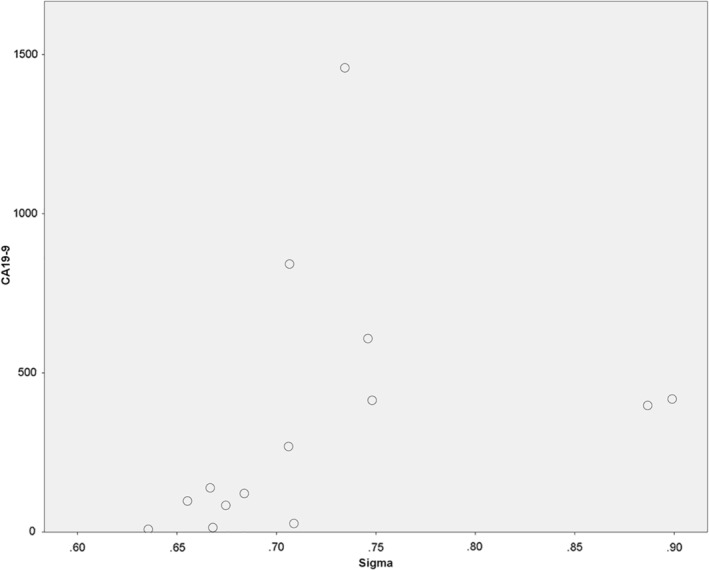
Spearman's correlation analysis between the tumor marker CA 19‐9 with the texture feature “Sigma” (r = 0.7, p = 0.01).
Official websites use .gov
A
.gov website belongs to an official
government organization in the United States.
Secure .gov websites use HTTPS
A lock (
) or https:// means you've safely
connected to the .gov website. Share sensitive
information only on official, secure websites.
Spearman's correlation analysis between the tumor marker CA 19‐9 with the texture feature “Sigma” (r = 0.7, p = 0.01).