
Fig. 4.
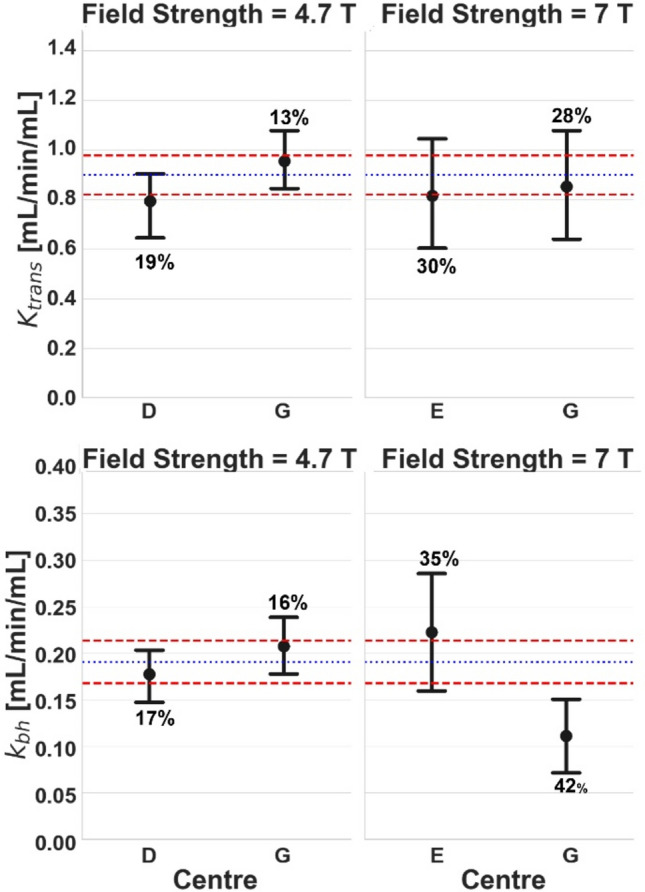
Comparison of baseline Ktrans (top row) and kbh (bottom row) [mL/min/mL] for different centres but at the same field strength: 4.7 T (left column) and 7 T (right column). Error bars and colour coding are the same as Fig. 2
Official websites use .gov
A
.gov website belongs to an official
government organization in the United States.
Secure .gov websites use HTTPS
A lock (
) or https:// means you've safely
connected to the .gov website. Share sensitive
information only on official, secure websites.
Comparison of baseline Ktrans (top row) and kbh (bottom row) [mL/min/mL] for different centres but at the same field strength: 4.7 T (left column) and 7 T (right column). Error bars and colour coding are the same as Fig. 2