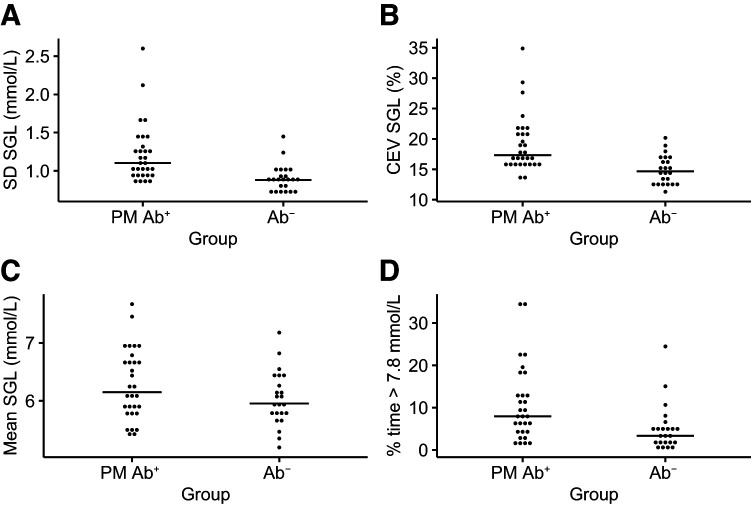
Figure 1.
Mean (SD) sensor glucose (A), mean CEV sensor glucose (B), mean sensor glucose (C), and mean percentage of time spent >7.8 mmol/L (>140 mg/dL) (D) at time of first CGM in PM Ab+ and age- and sex-matched (assigned at birth) Ab− children. Solid line represents median value in each group for metric shown in figure. SGL, sensor glucose level.

