Figure 1.
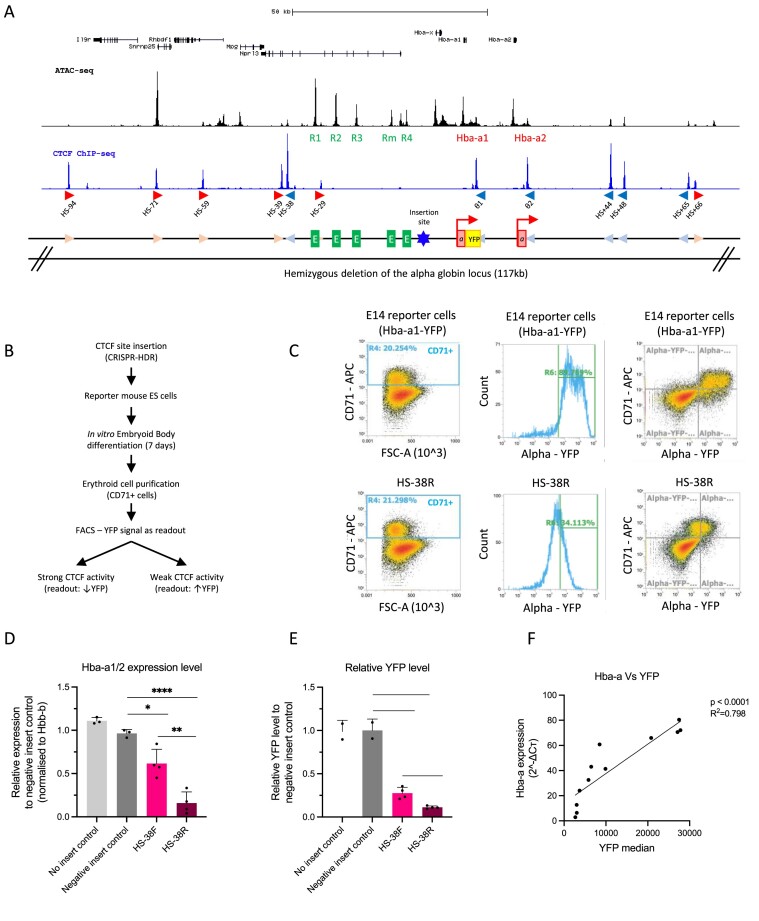
An experimental system to evaluate the capacity of individual CTCF elements to block enhancer–promoter interactions. (A) Top, UCSC refseq genes at the genomic locus encompassing the alpha-globin locus. ATAC-seq track (black) shows the accessible regions with the alpha-globin enhancer-like elements (R1–R4) and genes (Hba-a1, Hba-a2) indicated. The blue track shows CTCF ChIP-seq with the peaks enriched over CTCF sites that are marked in red (forward orientation) and blue (reverse orientation) arrows as well as their corresponding label starting from the left with HS-94. Below a graphical representation of the alpha-globin locus indicating all three regulatory elements: CTCF sites in light blue and pink arrows, the enhancer-like elements in green, and the genes in red with the YFP tag in yellow and the red arrow indicating the transcriptionally active genes. The CTCF site of interest was inserted between the enhancer clusters and the promoters indicated by the blue star. An allele of the alpha-globin gene locus (117 kb) was hemizygously deleted in the reporter mouse ES cells (mESCs) as indicated. (B) The workflow starting with The CTCF site of interest inserted into the hemizygous alpha-globin locus of the reporter mESCs by the CRISPR-HDR method. The modified reporter mESCs were differentiated into EBs and the cells were harvested for analysis. The YFP level of the CD71+ cell population in the EBs were determined by FACS analysis and interpreted as the readout of the CTCF ability to block enhancer–promoter interaction as indicated. (C) Top panels, FACS plots to characterise the control E14 mESCs upon EB differentiation; left panel shows the proportion of CD71+ erythroid cells from the total EB population at day 7 of differentiation. Middle panel is a histogram showing the YFP signal (Hba-a expression) specifically in the CD71+ erythroid population (as gated in left panel). The right panel shows the same data plotted for the whole population based on two parameters, the CD71 + erythroid marker and YFP. All CD71+ cells isolated from the differentiated EBs representing the erythroid population exhibit high level of YFP, indicating high expression of the alpha-globin as expected. The lower panels represent the same FACS profile for mESCs with the inserted HS-38R site. (D) RT-qPCR data showing that insertion of the HS-38 sequence in both the forward and reverse orientation (pink and maroon columns) significantly represses the expression of the alpha-globin genes (Hba-a1/2) when compared to the ‘no insert’ and ‘negative insert’ controls. Data is normalised to the β-globin (Hbb-b). Bars indicate the standard deviation, the black dots represent single experiment, and the stars indicate the statistical significance resulting from unpaired, two-tailed t-tests, ∗P< 0.05; ∗∗P< 0.01; ∗∗∗P< 0.001; ∗∗∗∗P< 0.0001. (E) Same as in (D) except this is based on the YFP levels measured by FACS of the reporter cells compared to the ‘no insert’ and ‘negative insert’ controls. (F) The expression of the alpha-globin genes is positively and significantly correlated to the level of the YFP in the samples (Linear regression, P< 0.0001, R2= 0.798).

