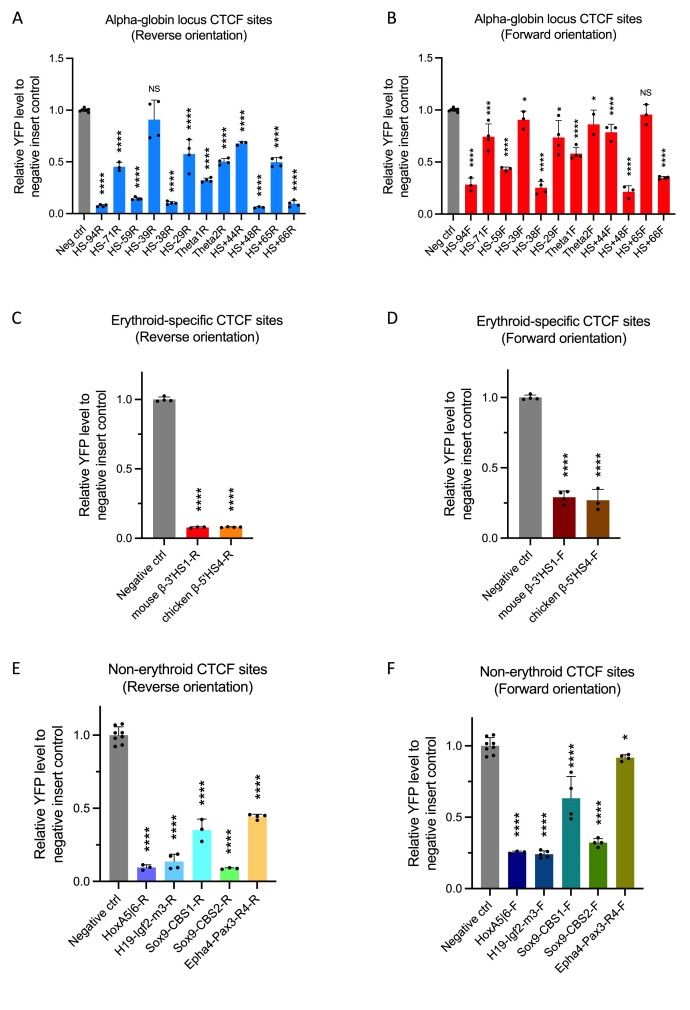
Figure 2.
Testing previously characterised CTCF elements for their insulation activity. (A, B) YFP levels derived from FACS analysis of EB cell populations derived from mESCs engineered to contain the indicated CTCF sites and plotted relative to a negative control mESC-derived signal. Nearly all CTCF sites in the alpha-globin locus blocked the enhancer–promoter interaction to variable degrees in both orientations. (C, D) Analysis as in panels above. Both β-globin locus CTCF binding sites in mouse (3′HS1) and chicken (5′HS4) significantly blocked the enhancer–promoter interaction. (E, F) Analysis as in panels above. CTCF binding elements from other non-erythroid specific loci also blocked the enhancer–promoter interaction and reduced alpha-globin expression to variable degrees. Bars indicate the standard deviation, the black dots represent single experiment, and the stars indicate the statistical significance resulting from unpaired, two-tailed t-tests, NS not significant; * P< 0.05; ** P< 0.01, *** P< 0.001, **** P< 0.0001.

