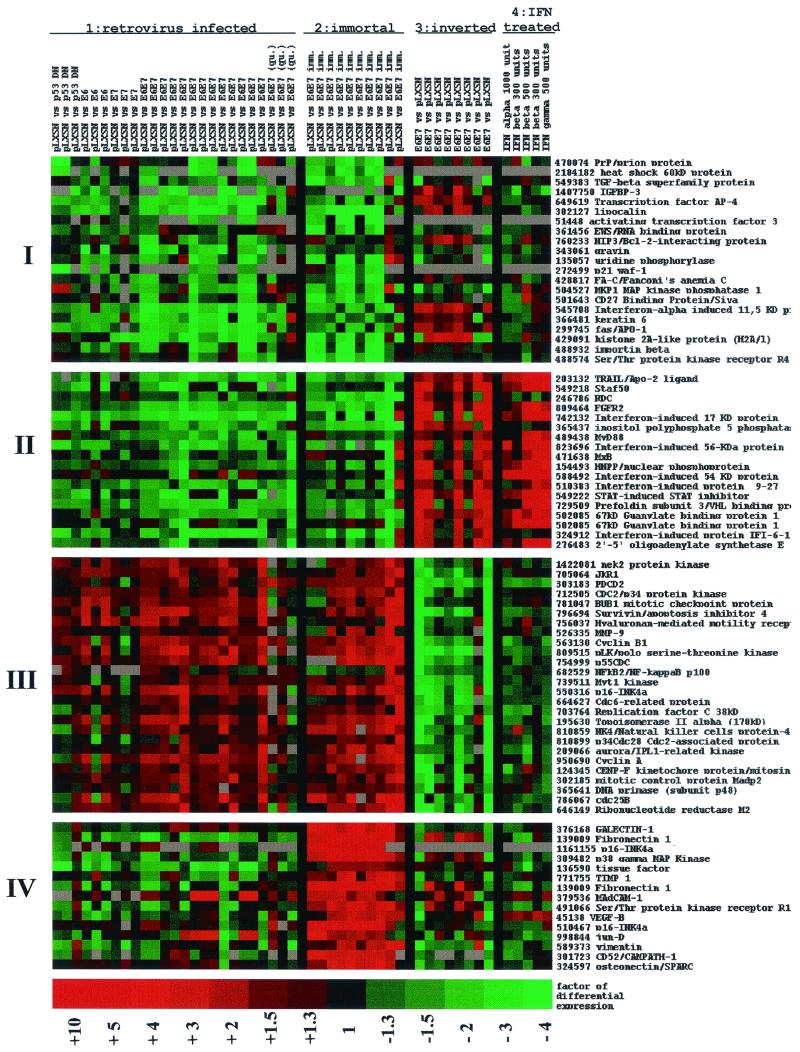
FIG. 1.
Cluster analysis of cellular gene expression. Data from 48 independent hybridization experiments examined multiple experimental conditions and different combinations of HPV-16 E6 and/or E7 genes or p53DN. Data were organized and displayed using cluster analyses (K-Means clustering algorithm). The four treatment groups are indicated at the top. Group 1 included cells expressing p53DN, E6, E7, or E6/E7 and maintained in the absence of growth factors with 1.4 mM Ca2+ to induce differentiation. Three experiments were performed using cells that were made quiescent but that were not induced to differentiate with calcium (qui). Group 2 included HPV-immortalized keratinocytes in Ca2+ to induce differentiation. Group 3 denotes a subset of experiments performed in parallel with group 1 but with inversion of Cy3 and Cy5 dyes as a control for labeling. Group 4 includes HPV-infected, differentiating keratinocytes treated with 300 to 1,000 of U IFN-α, -β, or -γ per ml. In groups 1 to 3, vector-only-infected cells are compared to HPV-infected cells; in group 4, E6/E7-expressing cells with and without IFN are compared. Clusters of differentially expressed mRNAs are shown on the left (I to IV); gene names and IMAGE clone IDs are given at the right. Color coding: green, downregulation of gene expression; red, induction; black, no significant change; grey, no data available.

