Figure 1.
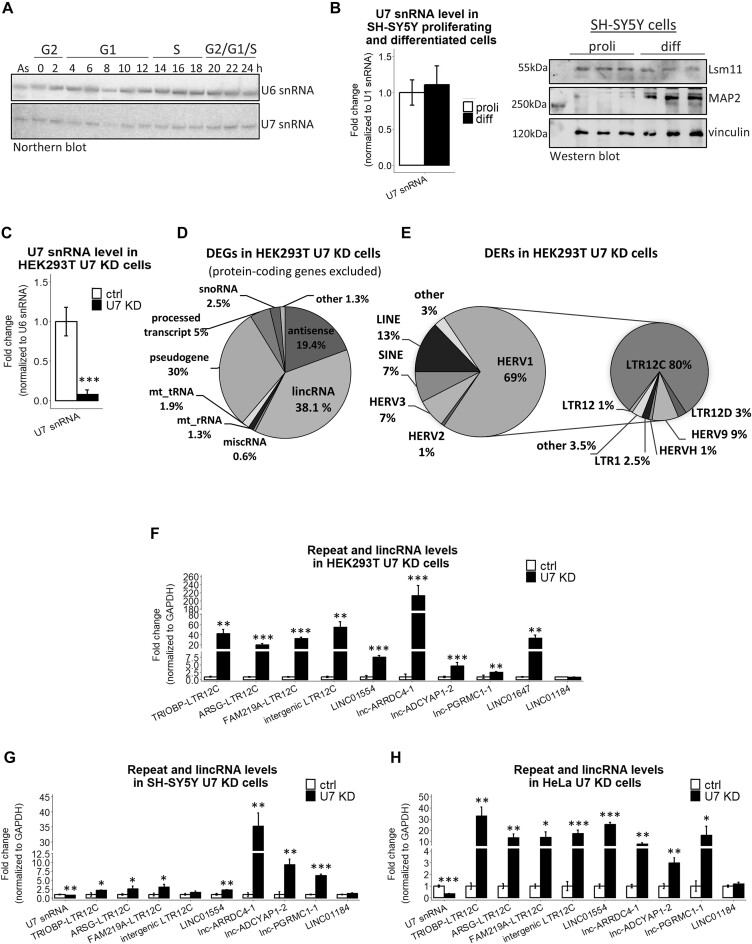
The expression level of U7 snRNA is inversely correlated with the expression of LTR12s and lincRNAs. (A) The levels of U7 snRNA in particular phases of the cell cycle were analyzed by Northern blotting, and U6 snRNA served as a loading control. The synchronization of HeLa cells was performed as described in (Figure 3A in (43)), and cell cycle phases at the indicated time points after release from nocodazole block are presented at the top. (B) U7 snRNA was detected by RT-qPCR, U1 snRNA levels were used for normalization. The level of Lsm11 protein was checked by Western blotting and immunodetection in proliferating (proli) and differentiated (diff) SH-SY5Y cells. MAP2 was used as a differentiation marker, and vinculin was used as a loading control. (C) The U7 snRNA knockdown efficiency in HEK293T cells treated with ASO targeting U7 snRNA (U7 KD) in comparison to control ASO (ctrl) was checked by RT−qPCR. U6 snRNA levels were used for normalization. (D, E) Pie charts showing differentially expressed genes (DEGs) (D) and differentially expressed repeats (DERs) (E), with special consideration of the HERV1 class in U7 KD cells. For clarity, protein-coding genes were omitted from the DEG analysis. (F–H) The expression levels of selected LTR12s and lincRNAs were analyzed in HEK293T (F), proliferating SH-SY5Y (G) and HeLa (H) cell lines, ctrl cells and U7 KD cells by RT−qPCR. LINC01184 was not identified as a DEG in the RNA-seq data and was used as a negative control. GAPDH levels were used for normalization. Data are presented as means ± SDs (n = 3). P values were calculated using two-sided Student's t test, and statistical significance was defined as follows: *P ≤ 0.05; **P ≤ 0.01; ***P ≤ 0.001.

