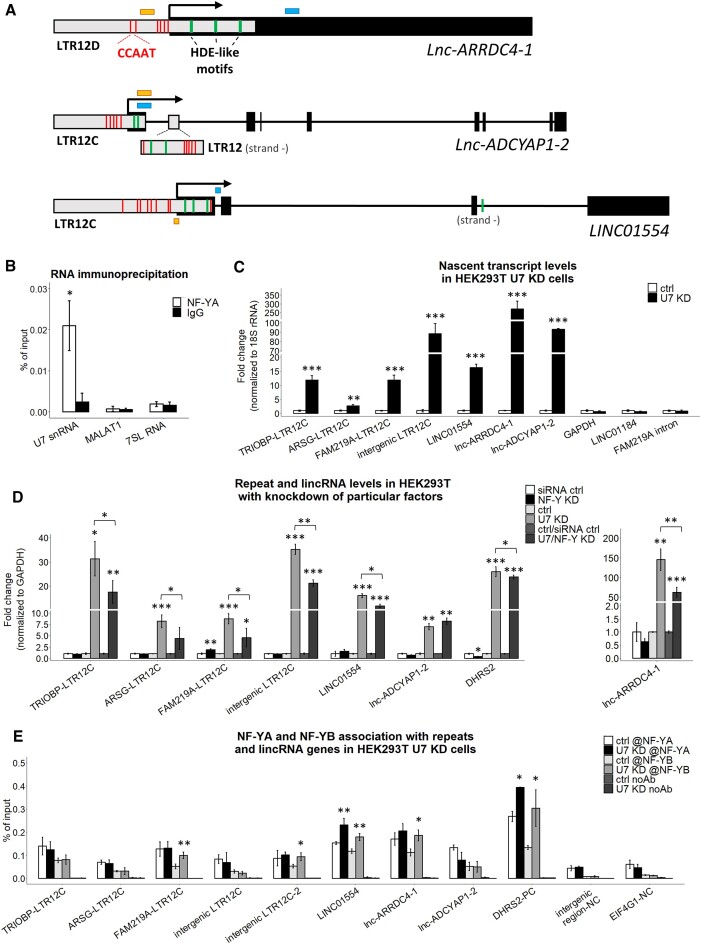
Figure 4.
U7 snRNA regulates the transcription of LTR12s and LTR12-containing lincRNAs. (A) Schematic representation of lnc-ARRDC4-1, lnc-ADCYAP1-2 (isoform ENST00000670380.1) and LINC01554 (isoform ENST00000436592.5). The black boxes represent exons, the gray boxes illustrate LTR12 elements, and the lines represent introns. The positions of the 5′ ends of the genes are indicated by arrows. Positions of the HDE-like and CCAAT motifs (within LTR elements only) are indicated in green and red, respectively. The locations of the amplified qPCR products in the 4sU and ChIP experiments are shown as blue and yellow boxes, respectively. (B) The interaction between U7 snRNA and NF-YA subunit was analyzed using RNA immunoprecipitation followed by RT-qPCR in HEK293T wild-type cells. The abundantly expressed RNAs, MALAT1 and 7SL RNA, were used as negative controls. (C) The levels of newly transcribed LTR12s and lincRNAs in HEK293T U7 snRNA knockdown cells (U7 KD) compared to ctrl cells (ctrl) were tested by the 4sU assay followed by RT−qPCR. The levels of GAPDH, LINC01184 and the FAM219A intron fragment (outside LTR12) were used as negative controls. 18S rRNA was used for normalization. (D) The expression levels of selected LTR12s and lincRNAs in HEK293T cells with combined depletion of U7 snRNA and all NF-Y subunits. GAPDH levels were used for normalization. DHRS2 was used as a positive control. (E) NF-YA and NF-YB binding to LTR12s and lincRNA gene regions containing CCAAT sequences near HDE-like motifs in HEK293T ctrl and U7 KD cells was analyzed by ChIP followed by qPCR. Empty beads were used as a negative IP control. The bars represent the recovery, expressed as a percentage of the input (the relative amount of immunoprecipitated DNA compared to the input DNA after qPCR analysis). DHRS2 was used as a positive control (PC). An intergenic region and the fragment of EIF4G1 gene deprived of CCAAT were used as negative controls (NC). Statistical significance was calculated to assess the association of NF-Y subunits within selected genomic locations between U7 KD and ctrl cells. @, antibody. Data are presented as means ± SDs (n = 3). P values were calculated using two-sided Student's t test, and statistical significance was defined as follows: *P ≤ 0.05; **P ≤ 0.01; ***P ≤ 0.001.

