Figure 1.
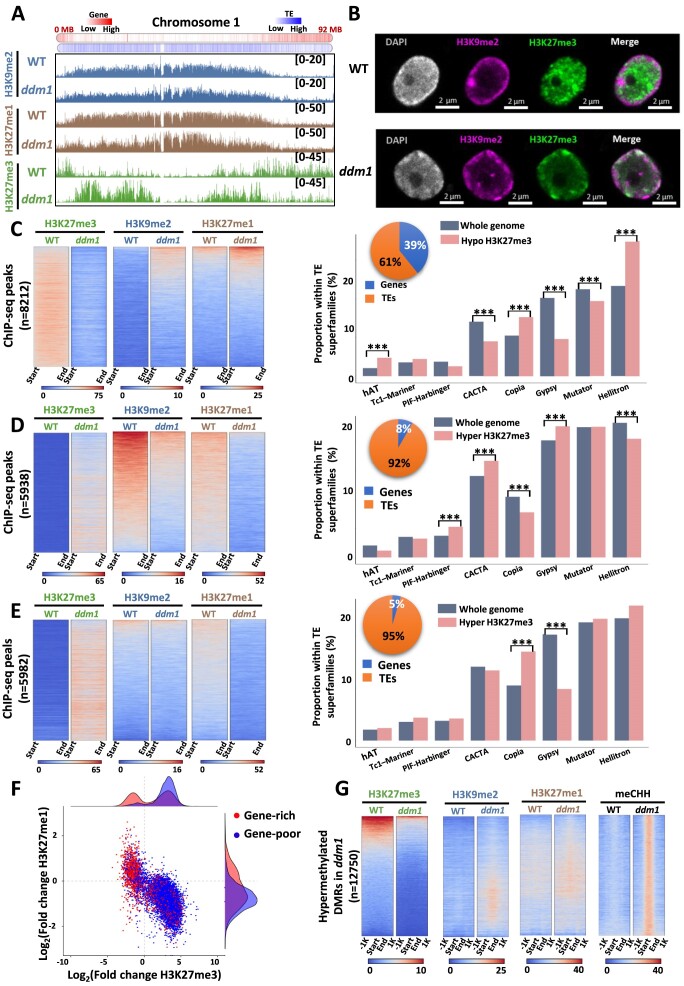
ddm1 displays a reconfiguration of its epigenome. (A) Screenshot of chromosome 1 from JBrowse2 genome browser representing H3K9me2 (blue), H3K27me1 (brown) and H3K27me3 (green) ChIP-seq data in wild type and ddm1 mutant. Gene density is displayed at the top with a higher density of TEs and genes respectively in blue and red. (B) Immunofluorescence detection of H3K9me2 (pink) and H3K27me3 (green) histone modifications and DAPI staining (grey) in isolated tomato nucleus from wild type and ddm1. (C–E) On the left panels, heat-maps representing ChIP-seq profiles for H3K27me3 (green), H3K9me2 (blue), and H3K27me1 (brown) within H3K27me3 hypomethylated regions in ddm1 compared to the wild type (C); within H3K27me3 hypermethylated regions and H3K9me2 hypomethylated regions (D); within H3K27me3 hypermethylated regions and no change in H3K9me2 regions (E). The color gradient from blue to red characterize the counts from low to high in the respective regions. On the right panels, TEs superfamilies repartition in percentage for the whole tomato genome (grey) and for regions of each class (pink). Pie charts represent the proportion of genes (blue) and TEs (orange) in each class. *** corresponds to significant differences (pvalue < 5% with a Student test) observed between two groups indicated by black bars. (F) Scatter plot of TEs in gene-rich regions (red), TEs in gene-poor regions (blue) with trend line according to the fold change of H3K27me3 on x-axis and H3K27me1 on y-axis. (G) Heatmaps of ChIP-seq signals (H3K27me3 (green), H3K9me2 (blue), H3K27me1 (brown)) and DNA methylation (CHH (black)) from differentially methylated regions (DMRs) in ddm1 compared to WT and selected in Corem et al. (2018).

