Figure 3.
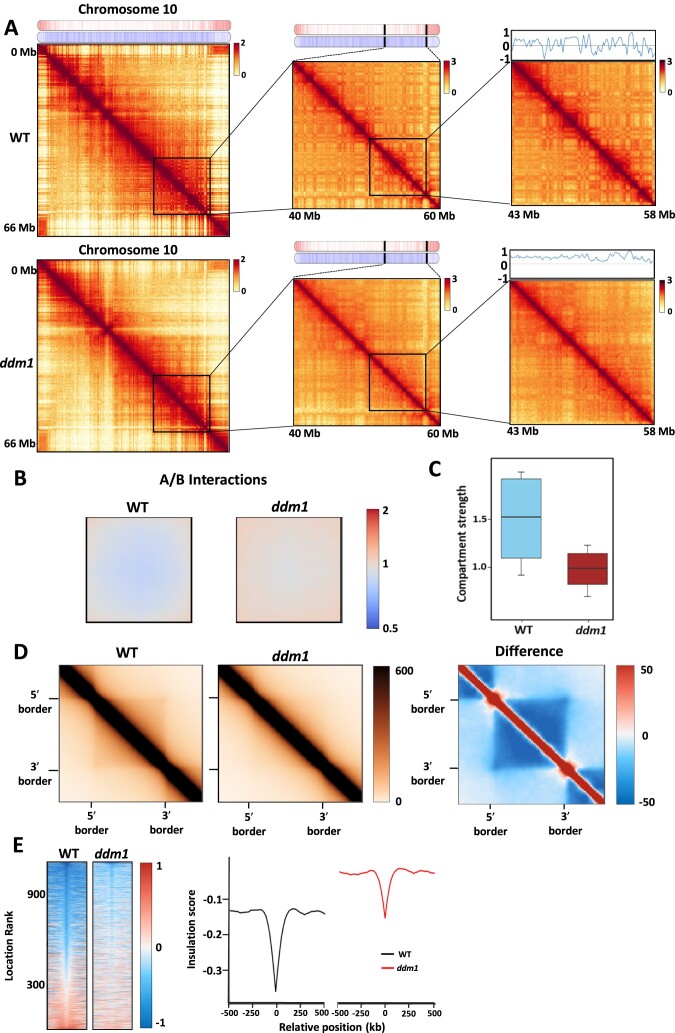
Chromatin architecture is affected in the ddm1 mutant with a weakened compartmentalization. (A) Chromosome 10 Hi-C interaction map at increasing levels of resolution. Gene and TE density are pictured at the top of the first map and a quantification of the compartmentalization, represented by a binary segmentation of the eigenvector (obtained with cooltools software) is shown on the top of the last map. (B) Analysis of compartment dynamics according to the interactions between compartments for the wild type and ddm1 (obtained with Pentad software). (C) Boxplot of compartment strength calculated from inter- and intra-compartment interactions for the wild type and ddm1. (D) Aggregate TAD analysis in wild type and ddm1 (left), and differential analysis is presented (right). Dark blue denotes a loss of interaction in ddm1 (obtained with GENOVA software). (E) Insulation heatmap (left) with a main insulation profile represented as the insulation score versus the relative position in kb (right) in wild type (grey) and ddm1 (red). The right panel shows an average score and each row corresponds to a TAD-border in the left panel.

