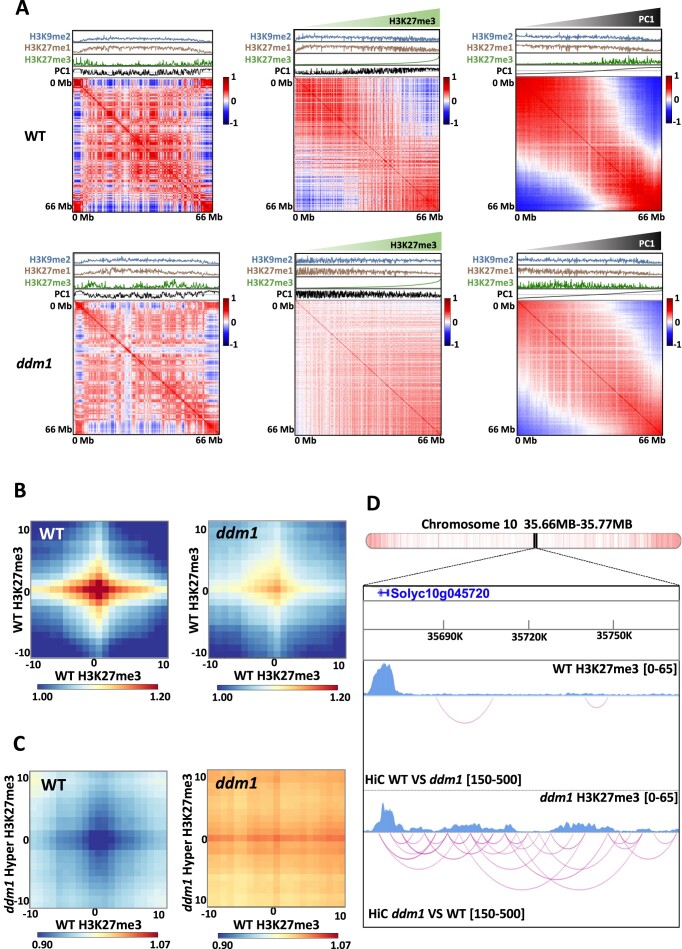
Figure 4.
Reconfiguration of the epigenome in ddm1 mutant induces new interactions across the genome. (A) Pearson correlations of distance-normalized Hi-C interaction frequency maps of chromosome 10. The ChIP-seq signal for H3K9me2 (blue), H3K27me1 (brown), H3K27me3 (green) and PC1 component from principal component analysis (black) were aligned to the map, for wild type and ddm1 (left). Maps with reorganized bins according to their H3K27me3 (middle) and PC1 value (right). (B-C) Aggregate plots quantifying the mean of aggregated WT and ddm1 Hi-C contacts matrices between regions marked with H3K27me3 in the wild type (B) and between new regions marked with H3K27me3 in ddm1 versus the regions previously mentioned in the wild type (C). (D) Screenshot of a region in the chromosome 10 from WashU genome browser for H3K27me3 ChIPseq data, depicted in light blue, and Hi-C differential interactions arcs (pink). Differential interaction arc intervals were chosen to illustrate the most significant Zscores corresponding to WT-specific interactions at the top, and ddm1-specific interactions at the bottom. Gene density (with white corresponding to a low density and red, a high density of genes) of the chromosome and the portion of the region can be seen at the top of the screenshot.

